
3 Simulation results » History » Version 26
« Previous -
Version 26/32
(diff) -
Next » -
Current version
MOURA, Ninon, 03/23/2016 11:20 AM
3. Simulation results
Now we have .pcap files with all the informations about the packets exchanged during the Iperf command. We will use Wireshark to produce curves with these files.
First, we will analyze the evolution of sequence numbers.
On the Time/Sequence graph with Wireshark, the upper curve corresponds to the receiver window, the middle one is the TCP segments that are sent and the lowest one is the actual ACK number.
3.1. Evolution of sequence numbers
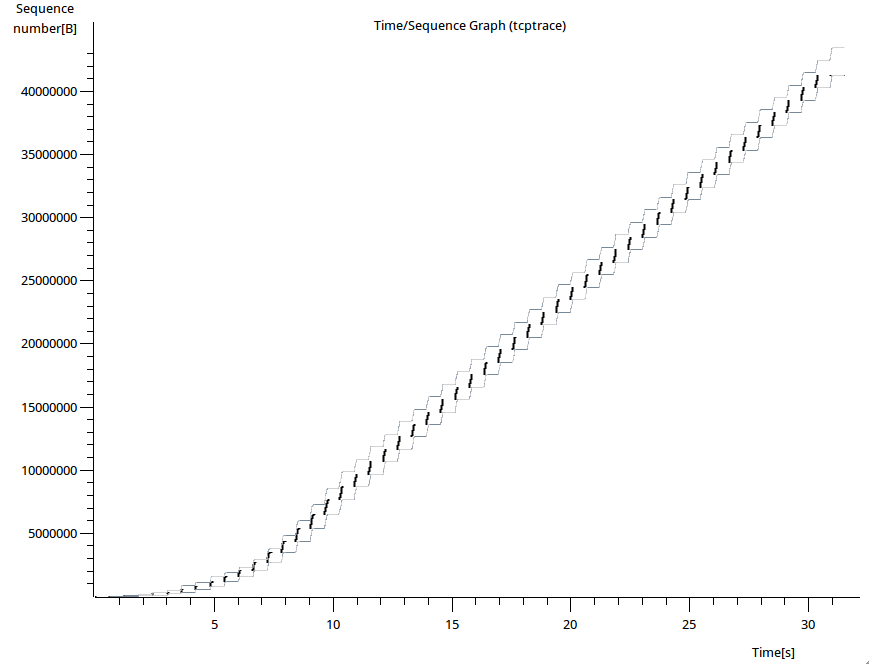
Figure 1 : Evolution of sequence numbers without PEPsal

Figure 2 : Evolution of sequence numbers without PEPsal (zoom)
In these two figures we observe a classical evolution of sequence numbers using TCP. We clearly observe the slow start phase during the first 9 seconds and then we are in a congestion avoidance phase without errors. When we zoom on the curve, we can see the packets are sent by burst. This is because we have a huge delay so the transmission is limited by the window size (85KB). Consequently the terminal sends many packets until the window is full, then it has to wait acknowledgments before being able to send again.
Now we will observe the same curves but with PEPsal activated.
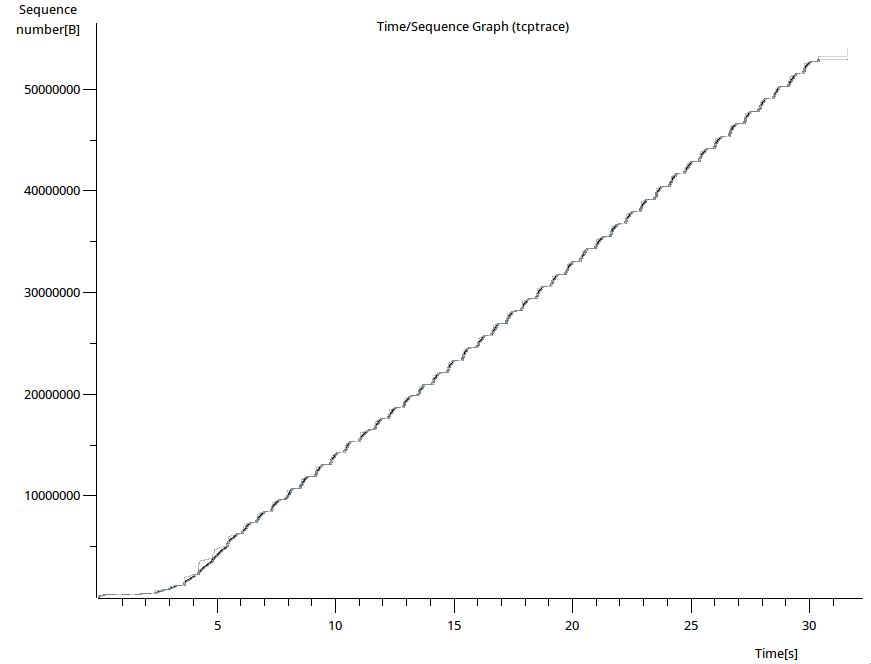
Figure 3 : Evolution of sequence numbers with PEPsal

Figure 4 : Evolution of sequence numbers with PEPsal (zoom)
On this curve we observe that the slow start phase is quite shorter (around 5 seconds). Consequently we can achieve higher sequence numbers faster, se we increase the throughput.
When we zoom, the behaviour is also very different than without PEPsal. Indeed here we see that the 3 curves (window, TCP segment and ACK) are very close because when a packet is sent, it is acknowledged by the PEP and the delay between the remote terminal and the PEP is negligible.
To highlight the improvement due to PEPsal, we decided to decrease the size window to 20KB. We produced the two next curves :
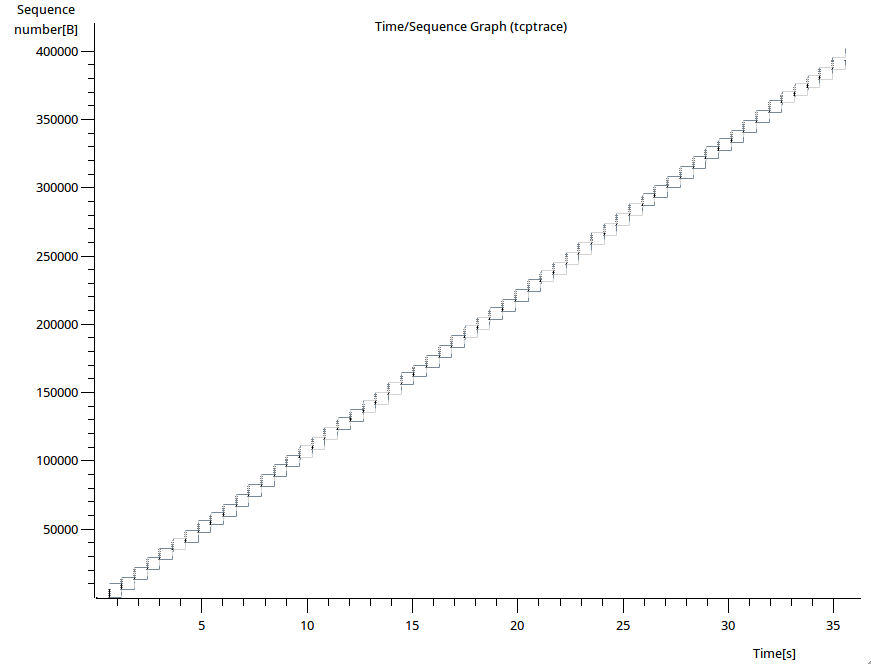
Figure 5 : Evolution of sequence numbers without PEPsal and with a window size of 20KB
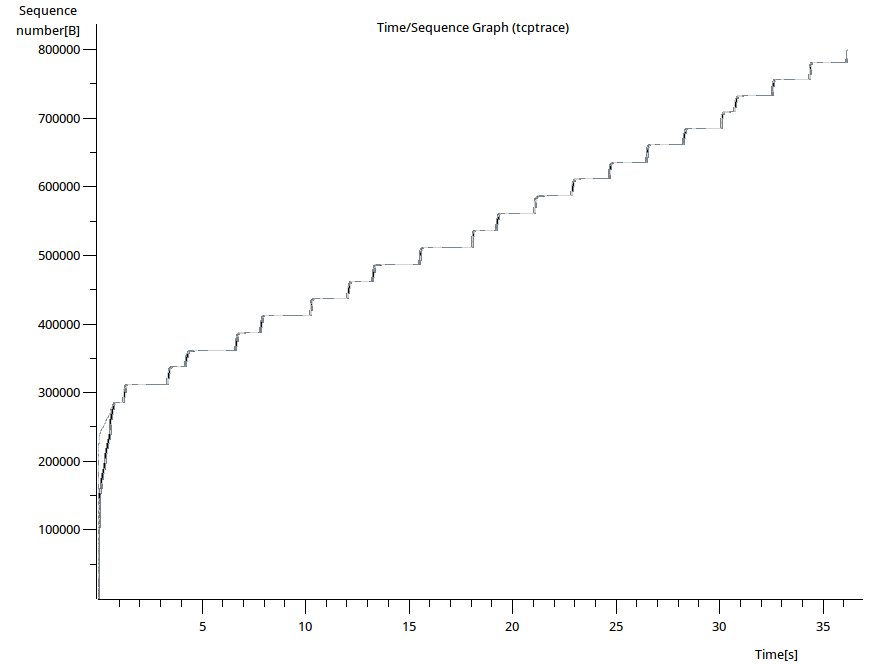
Figure 6 : Evolution of sequence numbers with PEPsal and with a window size of 20KB
Here the improvement thanks to PEPsal is clear. If we compare the sequence number achieved after 1 second, we get around 8000 without PEPsal and near 300000 with PEPsal (37 times more).
This part highlight the fact that PEPsal mostly increase the performances in the slow start phase, so it is better to use it when we have to deal with a lot of short connections.
3.2. Throughput
Now, throughput in fonction of time is plotted.
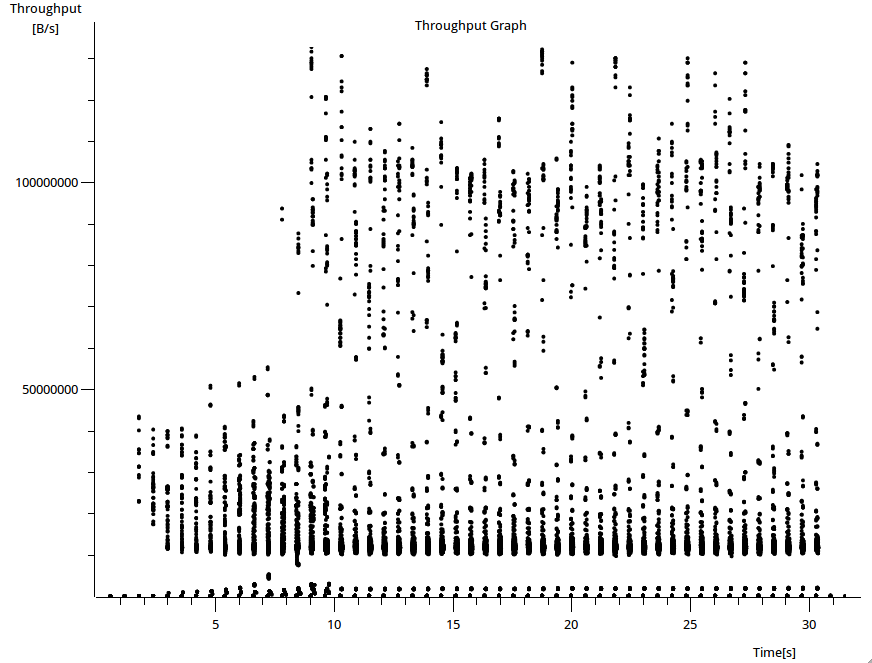
Figure 7 : Throughput without PEPsal
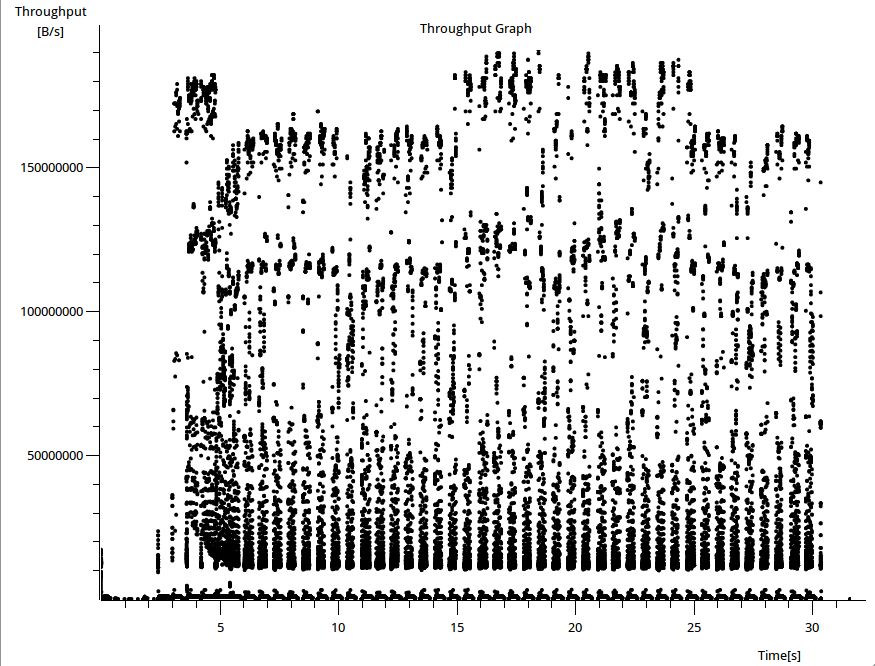
Figure 8 : Throughput with PEPsal
As expected, the throughput is better when we activate PEPsal and this is observable mostly at the beginning of the transmission (slow start phase).
3.3. RTT
In this part we observe the Round Trip Time (RTT) of each packet.
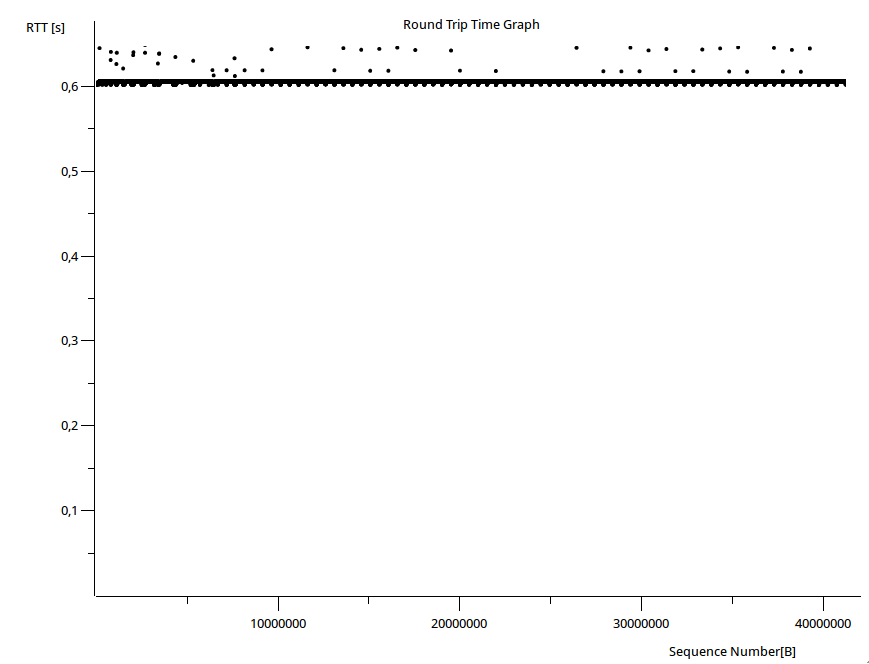
Figure 9 : RTT without PEPsal
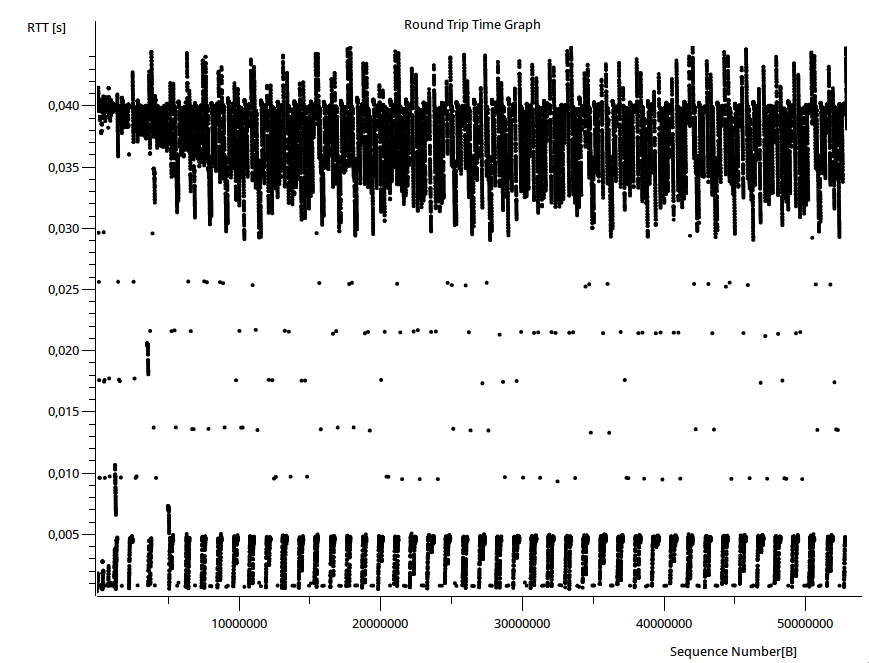
Figure 10 : RTT with PEPsal
Without PEPsal we have a RTT quite constant around 600ms. This is legitimate because we added delay on the link to get this RTT. But when we activate PEPsal, the sender is fooled and does not see the satellite link. Consequently the observed RTT is less than 50ms which corresponds to the transmission time along the Ethernet wire and the processing time.