
Previous :Receiving antenna building Next :Conclusion
APT images reception
Now we know that our antenna is receiving correctly the APT signals, we want to decode this signal and to display the weather images. At first, we used a specific software WXtoImg which demodulate directly the APT signal and do automatically all the processing to display APT images. And then we did all the demodualtion and processing by ourself using LabView. But before, we will see how we were able to track NOAA satellites and to know when were the best passes over our city.
WXTrack
WXTrack is a software that was available in our laboratory. It allows to track any NOAA satellites and to get many information about the passes above a city, the duration of the pass, etc. The software interface looks like this:
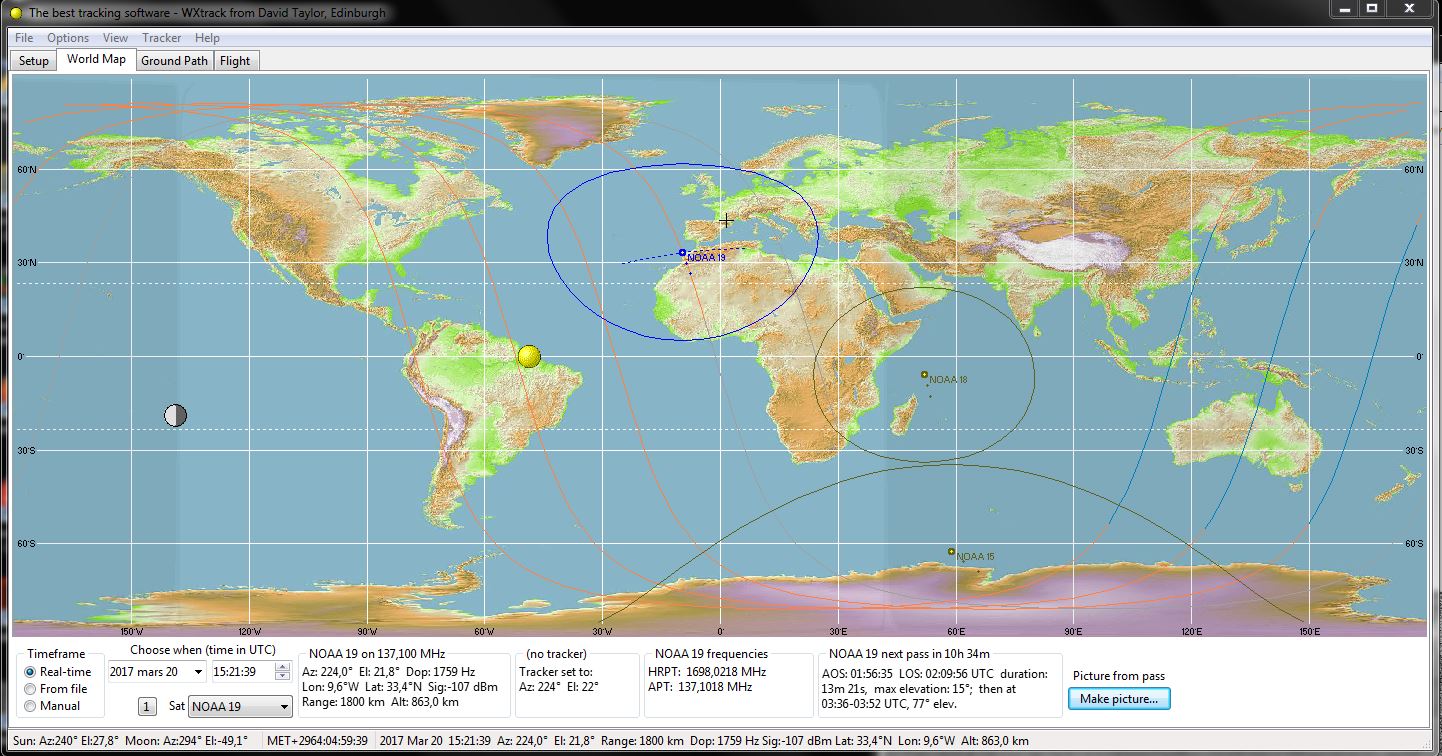
WXTrack interface
We can see many information on the bottom part,about the next pass, the time and the duration, the current position, altitude and range of the satellite. We can also get the maximum elevation angle during one pass which is important for the quality of received signal. Indeed, the more the elevation angle is high, the better the quality is, as the satellite is closer to our antenna when the elevation is high.
Thanks to this software we were able to know when we can had the signals with the best quality.
WXtoImg
Tracking
We used mainly this software to decode the signal but by tunning some parameters about the minimum elevation angle we want, the minimum duration on the visibily for example, the software can also provide a list of satellite pass like this one which is very useful. It can be an alternative to WXtrack even if it is less complete.
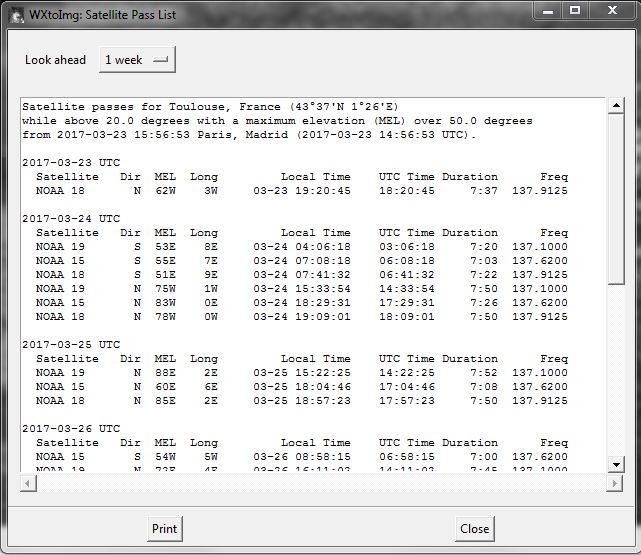
Satellite pass list
Processing
The software is able to scan a signal which come from the sound card of the computer. That's why we used a radio receiver similarly to the validation step, by selecting the accurate frequency depending on the satellite above the city and we connected this receiver to the sound card thanks to an audio cable. We can see the system on this picture:
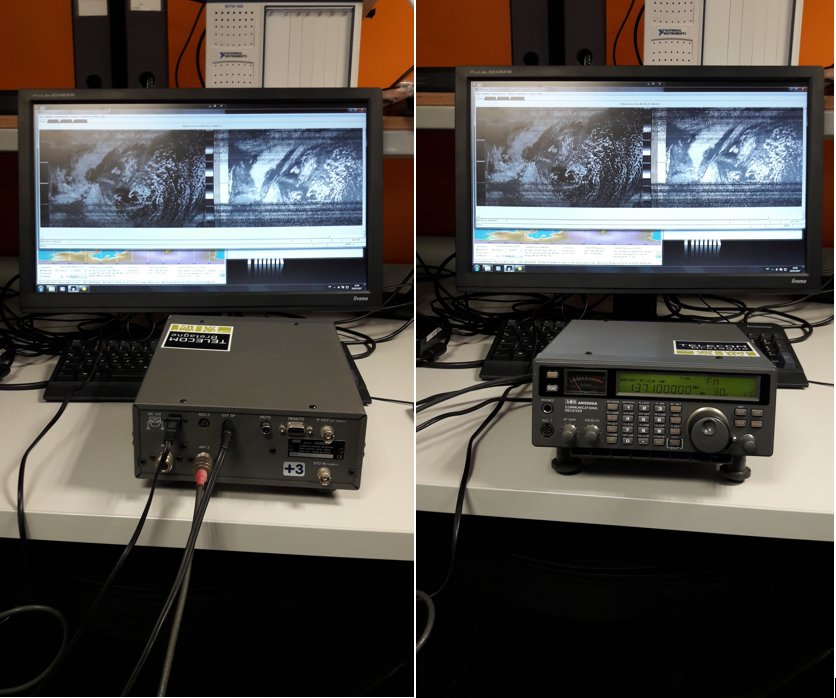
Radio receiver and WXtoImg
WXtoImg has several options in order to record and process the signal. It can be either automatically recorded when the elevation is above a given threshold or manually done. Moreover, we can allow several processing techniques to get better quality pictures. One of the most important feature of this tool is the Doppler correction. During the process, we can enable or not the use of a DPLL to correct the Doppler shift and have straight pictures. Indeed, if we don't allow that, the resulting picture will contain some bends. We can see this effect on the following picture:
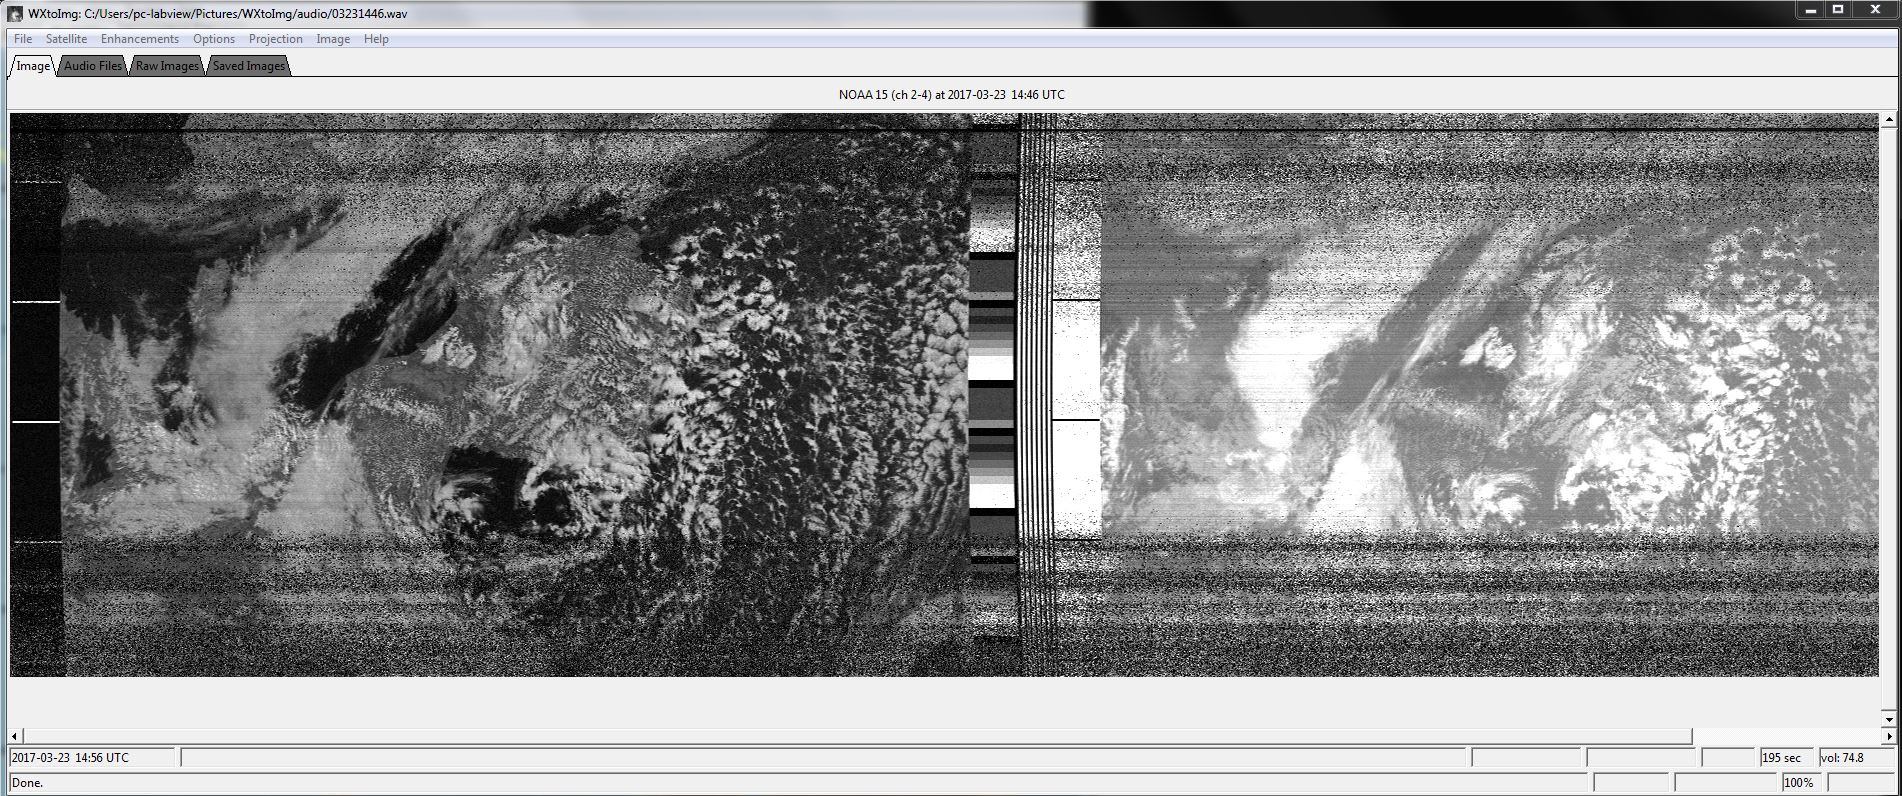
Weather image with some bending effects due to Doppler drift
We can observe some slight bending effect.
And here is one image that we recorded using the Doppler correction:
Weather image using Doppler correction
We can observe that the quality of the picture is varying. Indeed, when the recording was started, the elevation angle was quite low (about 10°). Then it increased, so the satellite was closer and closer and the quality is improved. Once it reached the maximum elevation (here it was about 65°), we observe the same phenomemon on the other side.
The software allows us not only to save the record in an audio file (only the input of the soundcard) without processing, but also to save images with or without Doppler correction. It also proposes some color enhancement in order to get more visible images and to see correctly the countries boundaries for example. Here is one example of this feature:
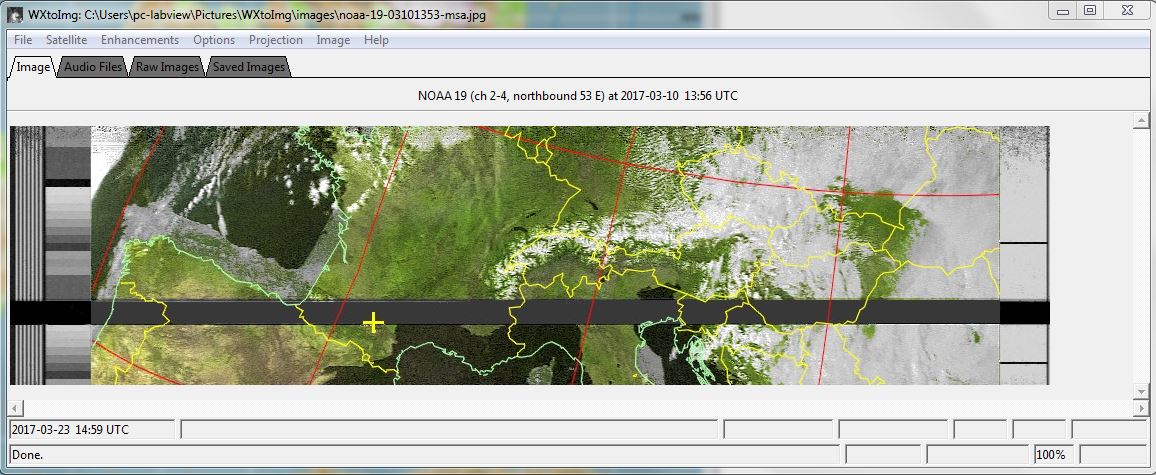
Weather image with colour enhancement
As we explained, this software does all the processing (AM demodulation, synchronization, etc) automatically given some input parameters. So, we tried to do it by ourself using LabView. For the next part, we only use the audio file provided by WXtoImg that contains the FM demodulated signal without any processing.
LabView
As an input we use the Sound File (.wav format) that we got from the output of WXtoImg. This signal has been frequency demodulated. As it was explained in the signal description part, the current signal is still amplitude modulated around a carrier at 2.4kHz.
We will present a schematic view of our implementation:
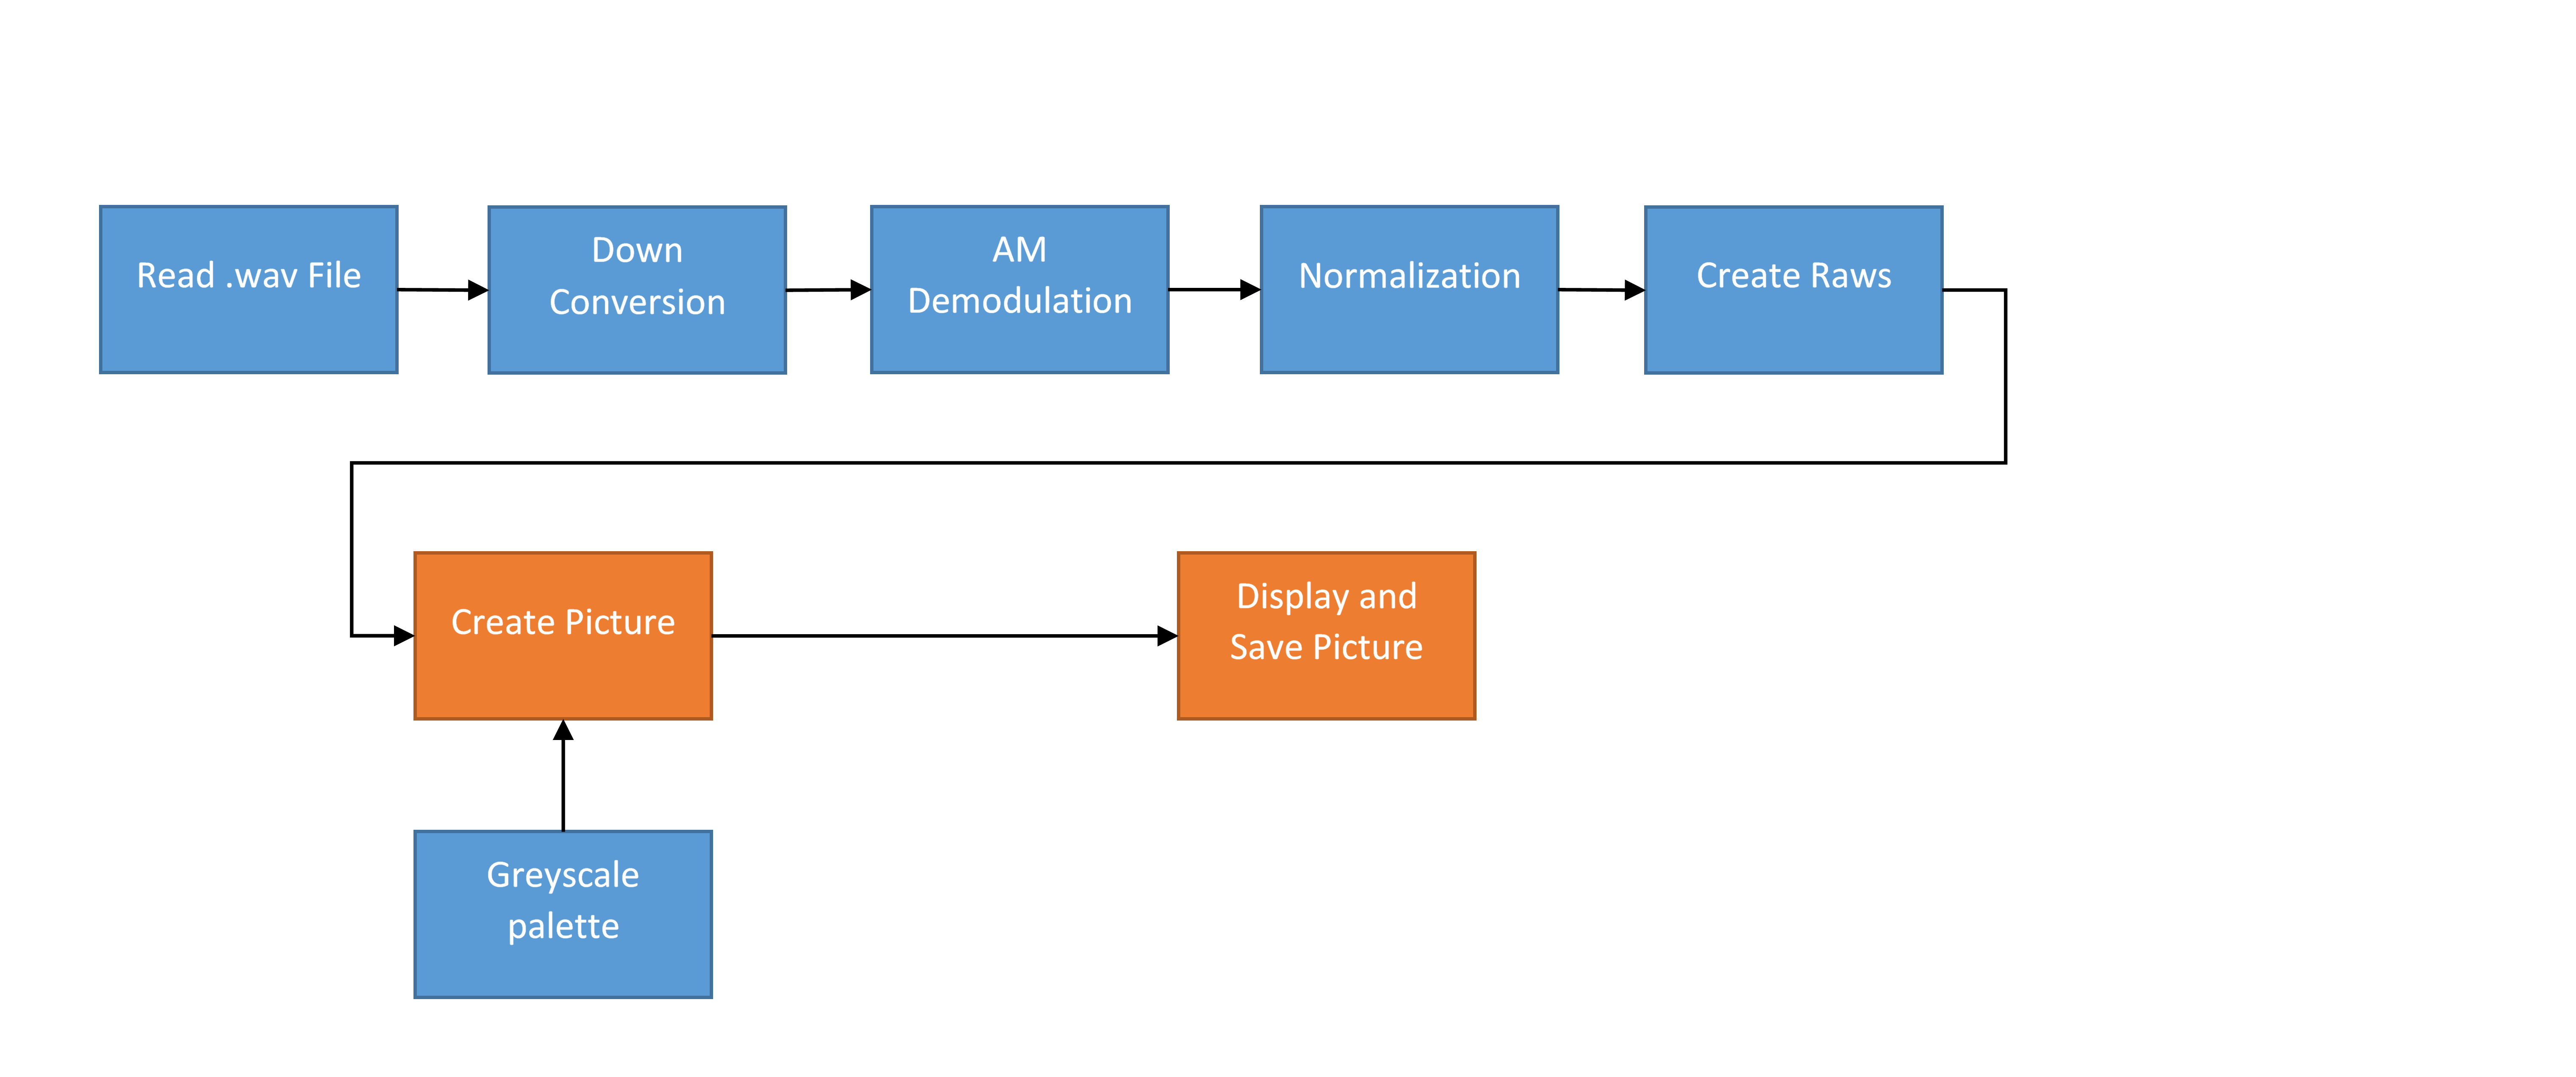
Implementation scheme
At first, we read the .wav file to get data. We just check that the obtained signal is around 2.4kHz:
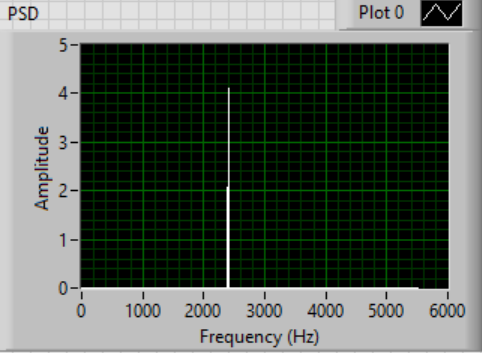
Signal PSD
Then, we put this signal in baseband to process it. To do that, we used a Down-Conversion function provided by the Labview libraries. Next, this signal goes through the AM Demodulation block that is also provided by the Modulation Toolkit of Labview. At the output, we get decimal values for amplitudes between -1 and 1. In order to get values between 0 and 255, we normalized it to match with greyscale values.
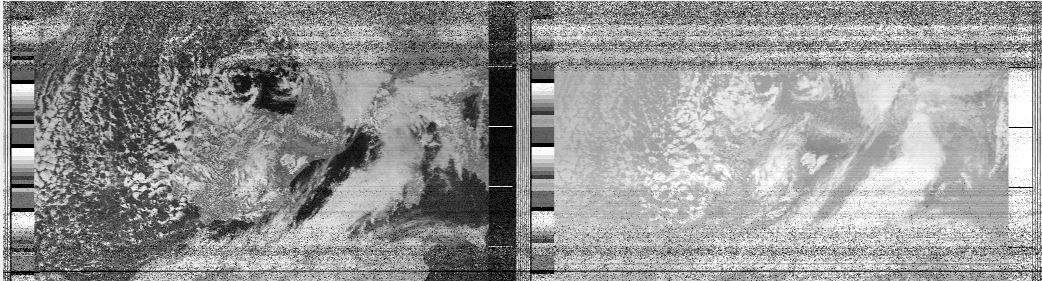
Once we have these values, we create the raws and store in a matrix to create a picture using a greyscale palette as an input colour for this picture. The picture is then stored at the .bmp format. Here is the result for one of our record:

Weather image using Labview processing
Here is a longer record:

Weather image using Labview processing
We can see more Doppler effect on these results because our synchronization using our Labview implementation is probably less efficient than the one used in the WXtoImg software.
Previous :Receiving antenna building Next :Conclusion