
22 Measurements regarding the useful signal and approximation of the signal-to-noise ratio » History » Version 5
« Previous -
Version 5/9
(diff) -
Next » -
Current version
JANVIER, Thibault, 12/15/2015 02:16 AM
2.2. Measurements regarding the useful signal and approximation of the signal-to-noise ratio
To carry out measurements on the desired carrier, the USRP has to be reconfigured. To do so, the program needs to stop running. Then, the selection of the tabs “USRP Configuration” and “Power Spectrum Signal” in the “Analog” thumb index will allow configuring the USRP and displaying the results.
The USRP down-converts the incoming signal according to the local oscillator frequency that is indicated as an input by the control command “carrier frequency”. Then it samples the down-converted signal at a sample rate given by the control command “IQ sampling rate”. To display the power spectrum of the entire channel, a down-conversion with a local oscillator frequency of 1,6 GHz has been chosen. Then the sampling rate has been set to 40 MHz to have a span of 20 MHz on the displayed power spectrum (from 1,6 GHz to 1,62 GHz). While the program is running, it is possible to configure in real time the settings of the power spectrum of the signal. The value “-1” that is set for the resolution bandwidth is a default value that chooses automatically the best resolution bandwidth possible taking into account the other parameters. The results are shown below.

Figure 11: Power Spectrum Density displayed on the user interface of the SDR signal analyser
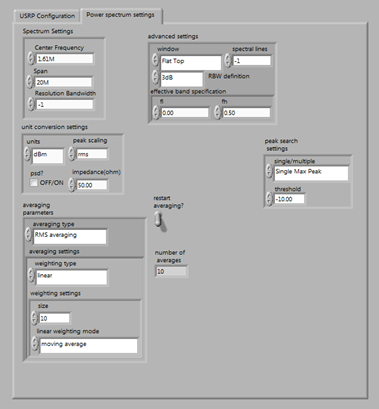
Figure 12: Interface to change the settings of the power spectrum that is displayed
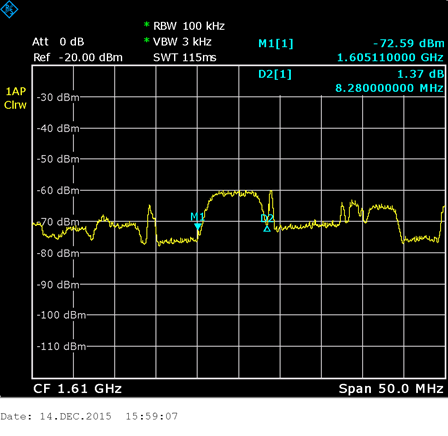
Figure 13: Power Spectrum Density displayed by the Rohde&Schwarz Signal Analyser
From Figure 11, we can notice that the actual resolution bandwidth of the SDR signal analyser has been set to 100 kHz. At equal resolution bandwidth, we can see that the power spectrum of the SDR signal analyser matches the one of the Rohde and Schwarz signal analyser. Thus, the total bandwidth of the channel measured from the SDR signal analyser matches the theoretical one and the one measured from the Rohde&Schwarz signal analyser.
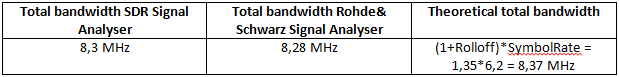
Table 3: Comparison of the measured bandwidth with respect to the theoretical one
The power spectrum of the SDR signal analyser tends to decrease with frequency because of the low-pass filter of 20 MHz-bandwidth that has been applied to the signal passing through the USRP (see Figure XX).
p=.!SNR.png!
p=.+Figure 14: Power of the useful signal and SNR+
Regarding the estimation of the maximum power of the signal, it is around 1.8 nW at the output of the USRP when no gain is added by the USRP. This value matches the power that is measured by the Rohde&Schwarz signal analyser which displays a maximum power around -60 dBm = 1 nW with a resolution bandwidth of 100 kHz.
Now that the power of the noise and the power of the useful signal have been measured, it is possible to compute the signal-to-noise ratio which is around 23 dB. This value is an approximation of what the actual signal-to-noise ratio could be. To check if this approximation is correct, let’s compute the theoretical value of the expected signal-to-noise ratio for this channel and compare it to the measurement of the SDR signal analyser. The theoretical signal-to-noise ratio is given by the following formula:
p=.!SNR_formula.png!
With:- EIRP_SL = 47 dBW, the EIRP of the antenna transmitting the signal (see this link)
- L_FS = the free space loss
L_FS=((4πR_0)/λ)^2*(1+0.42(1-cos(l) cos(L) ))
With R0 = 35786 km, altitude of a geostationary satellite
λ = 0.026 m, the wavelength
l = 43.6°, the latitude of Toulouse
L = 20.07°, the relative longitude between Toulouse and Eutelsat 21B
LFS = 205.36 dB - G/Tant = 22.1 dB/K, from the specification of the IGP antenna used to receive the signals
- k, the Boltzmann constant
- B = 1.35*6200 = 8370 kHz, the bandwidth of the channel (factor 1.35 due to the roll-off of the shaping filter)
Theoretical SNR Measured SNR
23.21 dB 22.72 dB
The measured SNR is close to the expected value. Therefore, the measurement gives a valid estimation about the actual SNR.