2. State of the art on signal analysis
Signal analysers are superheterodyne receivers that provide measurements and analysis of signals over a range of frequencies. They use analog and digital techniques to extract high-level metrics from the received signal that assess the quality of the physical layer in real time.
From an analog point of view, the power spectral density of the signal is displayed and allows measuring the bandwidth of the signal as well as noticing possible distortions, harmonics or spurious signals due to interference or non-linearities. The signal-to-noise ratio is also computed to quantify the power level of the useful signal relatively to the power of the noise that has been added.
From a digital point of view, signal analysers can provide information on the quality of the modulation regarding the noise level by displaying the constellation diagram of the modulated signal. This constellation allows displaying the distribution of the received symbols on a two-dimensional complex plane. To do so, the signal analyser has to retrieve each symbol from the received signal. Therefore, it needs to know the modulation that is used and its characteristics such as the shaping filter, the symbol rate and the type of modulation (see section 4. Signals to be measured). To correctly display a constellation, two key parameters need to be taken into account:- The initial sampling time instant: it should be chosen such that it lies in the middle of a received symbol and not between two adjacent symbols.
- The sampling rate: the received signal has to be sampled with a sampling rate equal to the symbol rate of the modulated signal.
Assuming those two optimal conditions, every sample will represent a received symbol with minimum inter-symbol interference. A simple example just below illustrates the phenomenon of inter-symbol interference given different sampling time instants T1, T2, T3 (the sampling rate is equal to the symbol rate).
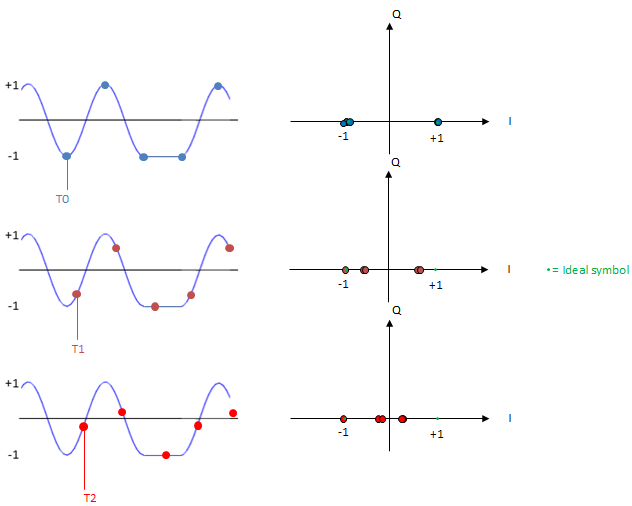
Figure 2: Impact of the initial sampling time instant on the constellation
As soon as minimum inter-symbol interference is reached (Sampling time instant = T1 in the illustration), the spread of the received symbols around the ideal locations depends on the performance of the transmitter, the jitter and the noise that has been added during propagation and reception of the signal. Then, it is possible to compute the error vector magnitude that gives information about the mean square distance between each actual received symbol and the ideal symbol it is most likely to be equal to, given the modulation that is used (maximum likelihood detection). This measurement is normalized by the power of the ideal symbol and is calculated using the following relationship.
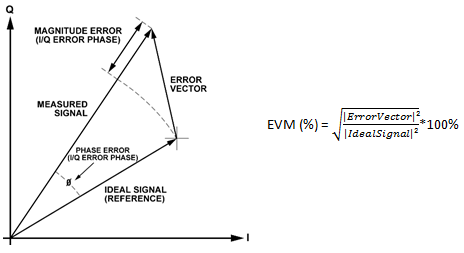
Figure 3: Definition of the Error Vector Magnitude (Reference here)
Therefore, the Error Vector Magnitude provides a quantitative assessment on the quality of the modulation at the receiving side. The smaller the error vector magnitude, the less likely it is to make errors on symbols decision, the better the performance of the link.
Consequently, by combining the high-level analog and digital measurements previously depicted, signal analysers provide us with an overview of the performance of the physical layer used to transmit and receive a signal. That’s why they are of prime concern in phases dealing with design validation of a communication system. The Software-Defined Radio (SDR) signal analyser to be implemented will measure and display the following figures of merit and characteristics of signals.
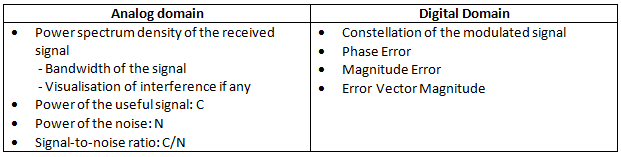
Table 1: Measurements to carry out
