- Table of contents
- 3.1 APT Demodulation & Decoding
3.1 APT Demodulation & Decoding
The FM signal is demodulated to a 2400Hz audio signal (in wave format). The receiver is responsible for the demodulation of the FM carrier and the output of an AM sub-carrier with the information signal within containing the image data. Every half a second, a row of the image is transmitted.
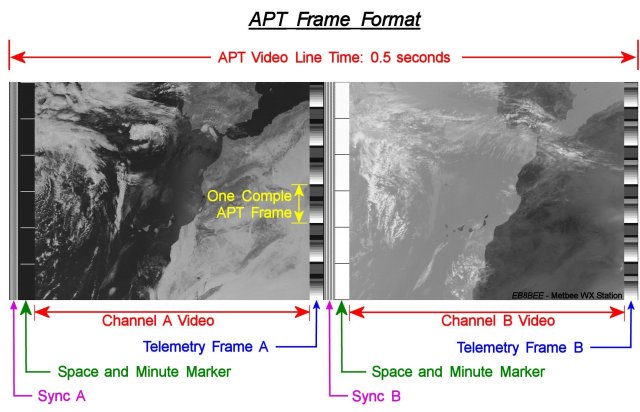
Figure 3.1 APT Frame Format
3.1.1 AM Demodulation
It is important to determine when each row starts for decoding the image. As said before every half of a second a row of the image is transmitted. But in each transmitted row (see Figure above) there are two different images. The first image is the one using the AVHRR visible frequencies (optical) and the second image is coming from the IR. In order to determine the beginning of each row of data for each (visible or IR) image the transmitted message signal contains a distinct syncronization pulse (see Figure 2.2 APT Synchronization).
The signal’s cross correlation with the synchronization square waveform gives us the frequency (number of maximums) of the repeated signal, and therefore the start of each row.
An illustration of the implementation followed is shown in the next Figure.
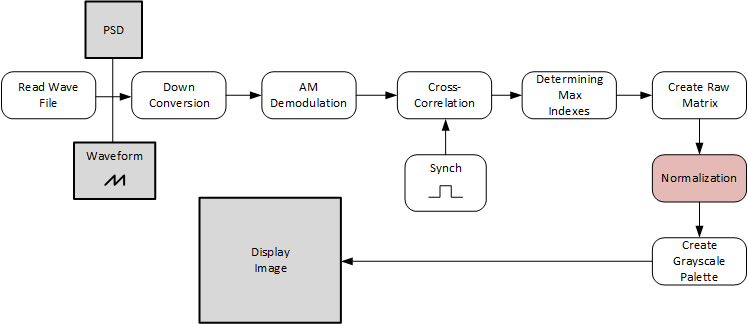
Figure 3.2 Implementation Diagram 1
The implementation was done in LabVIEW and the procedure wil be explained step by step. First a Sound File Read is used to read the .wav files and the output was plotted to verify the known 2400 Hz signal.
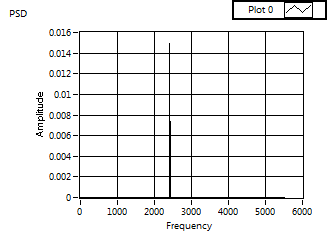
Figure 3.3 PSD
By cross correlating the demodulated signal using MT Demodulate AM with the synchronization square wave we have obtained the following figure. The synchronization wave square wave signal is shown in Figure 3.5. It is important to state that when the square wave is ideal the decoded images are better aligned in terms of channel A and B, meaning that the maximums are found correctly and are placed/sorted in a better order.
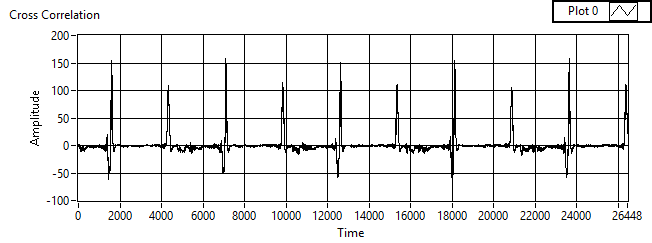
Figure 3.4 Cross Correlation obtained with Western Europe Short wav file
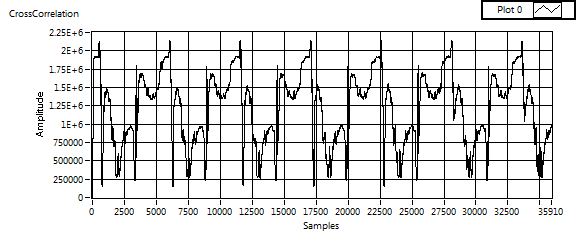
Figure 3.5 Cross Correlation with some Noise
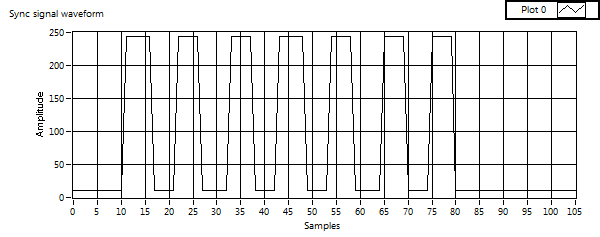
Figure 3.6 Synchronization Square Wave Signal
Showing that the signal is repeated every half second and in between we have the repeated signal of the other channel. The choice of the synchronization wave determines which channel will be decoded and displayed first.
This method gave rippled results in the display of the images and another walk-around needed to be thought.
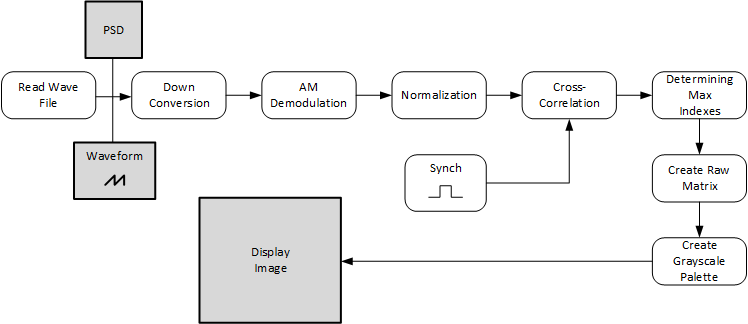
Figure 3.7 Implementation Diagram 2
3.1.2 Image Decoding and Display
The image decoding process will be extracted by the matrix which contains the max indexes. A creation of a vector is implemented in LabVIEW with the indexes of maximum value, which will allow us to know when a new image row starts. The next step is to create a matrix using the maximum indexes in order to display the image correctly, this matrix is reffered as raw matrix.
However, the previous method has bad performances if the signal is noisy. In this case, the maximums of the cross correlation are hardly detectable. Thus a synchronisation error is spreaded along all image's lines.
In order to avoid this effect, we decided to synchronised the lines using only the first maximum of the cross correlation. As we know that a line is composed àf 2080 pixels we are able to build the entire image based on this maximum.
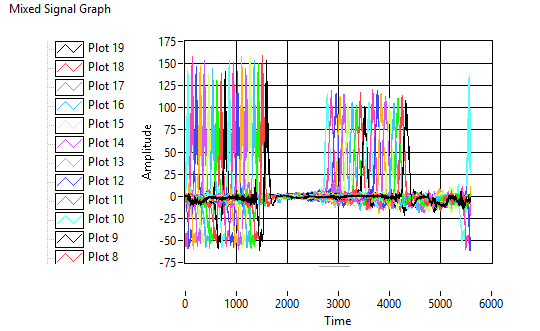
Figure 3.8 Sorted Signal
Lastly, a grayscle pattern is created to be used as an input for the Flatten Pixmap (0 for the minimum value and 255 for the maximum value) and this is inserted into the Draw Flatten Pixmap module.
Remark : We had some issues concerning full memory when decoding the biggest wav file. In fact, labview does not support arrays with sizes over a certain threshold. But this threshold is widely exceeded with our images. Thus, we had to compute the image in several pieces and get them together at the end of the process.
3.1.3 References
[1] Canary Satellite
