3. Lab Setup
To analyse and assess the quality of satellite signals, they need to be received first. This is done thanks to a 60cm-diameter Ku-band antenna whose elevation and azimuth can be controlled from a distance. This antenna embeds a low noise amplifier to amplify the received signals without degrading the signal-to-noise ratio at its output. Moreover, it embeds two low noise block down-converters to down-convert the received signal from Ku-band to a lower intermediate frequency that can be handled by the USRP platform acting as a receiver (see below for further details about the USRP). The block diagram of the antenna system is illustrated on Figure 4.
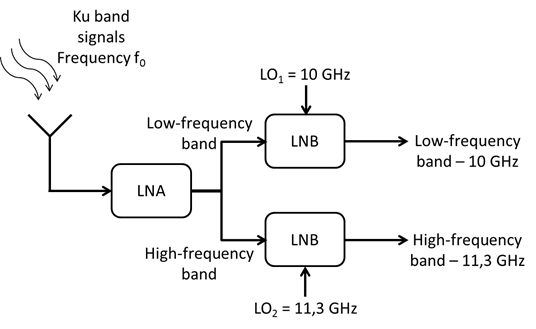
Figure 4: Block diagram of the antenna
- One high-frequency band
- One low-frequency band
In the previous subsection, it has been mentioned that signal analysers were superheterodyne receivers. In order to implement a signal analyser, a software-defined radio platform will be used to receive and process the signal coming from the antenna system. This software-defined radio platform is composed of a USRP connected to a computer via a PCI Express port that can handle 800MB/s of streaming data.
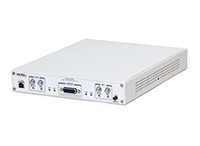
Figure 5: Ni USRP 2950R
The USRP 2950R which is used acts as an RF front end. First, it down-converts the signal coming from the antenna system to baseband. A PPL insures a coherent down-conversion to maximise the signal-to-noise ratio. Then, the baseband signal passes through a low-pass filter of 20 MHz 3-dB bandwidth to achieve image rejection and attenuate spurious signals due to non-linearities and adjacent channels. Finally, it performs an analog to digital conversion and samples the received signal to allow future digital processing of the data. The block diagram of the USRP used for this project is shown on Figure 6.
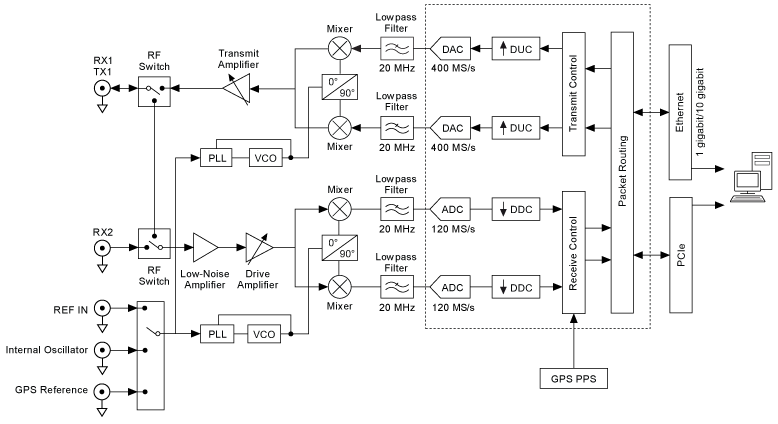
Figure 6: Ni USRP 2950R - Block diagram (Reference here )
Even if there is an FPGA included in the USRP 2950R, data processing will be handled by the computer using Labview to fetch the data from the USRP. Labview is a modular dataflow programming language that relies on block diagrams interconnected with each other. Each block diagram represents a node, a function that can be run as soon as its inputs are available. Then, it computes outputs used as inputs by other nodes. Any created program can be reused as a node in a higher-level program, hence the modularity of Labview. While running a program, each input can be controlled thanks to a user interface known as a “front panel”. Likewise, every output can be monitored using the front panel. As a matter of fact, the front panel is closely linked to the program called the “block diagram”. Indeed, every primary input of the block diagram are defined and controlled via the front panel.
Eventually, the final setup can be summed up by the following diagram.
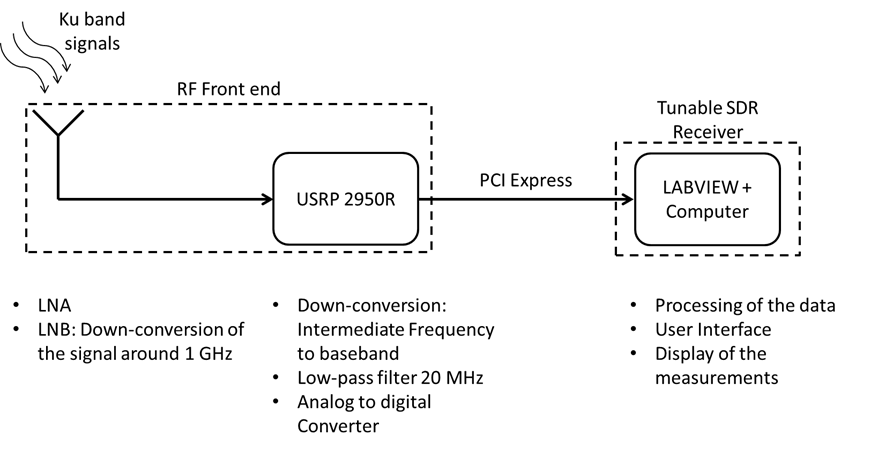
Figure 7: Block diagram of the lab setup
