
Test and results » History » Version 1
Version 1/19
-
Next » -
Current version
SANCHEZ, Eduardo, 03/26/2017 10:26 AM
Test and results
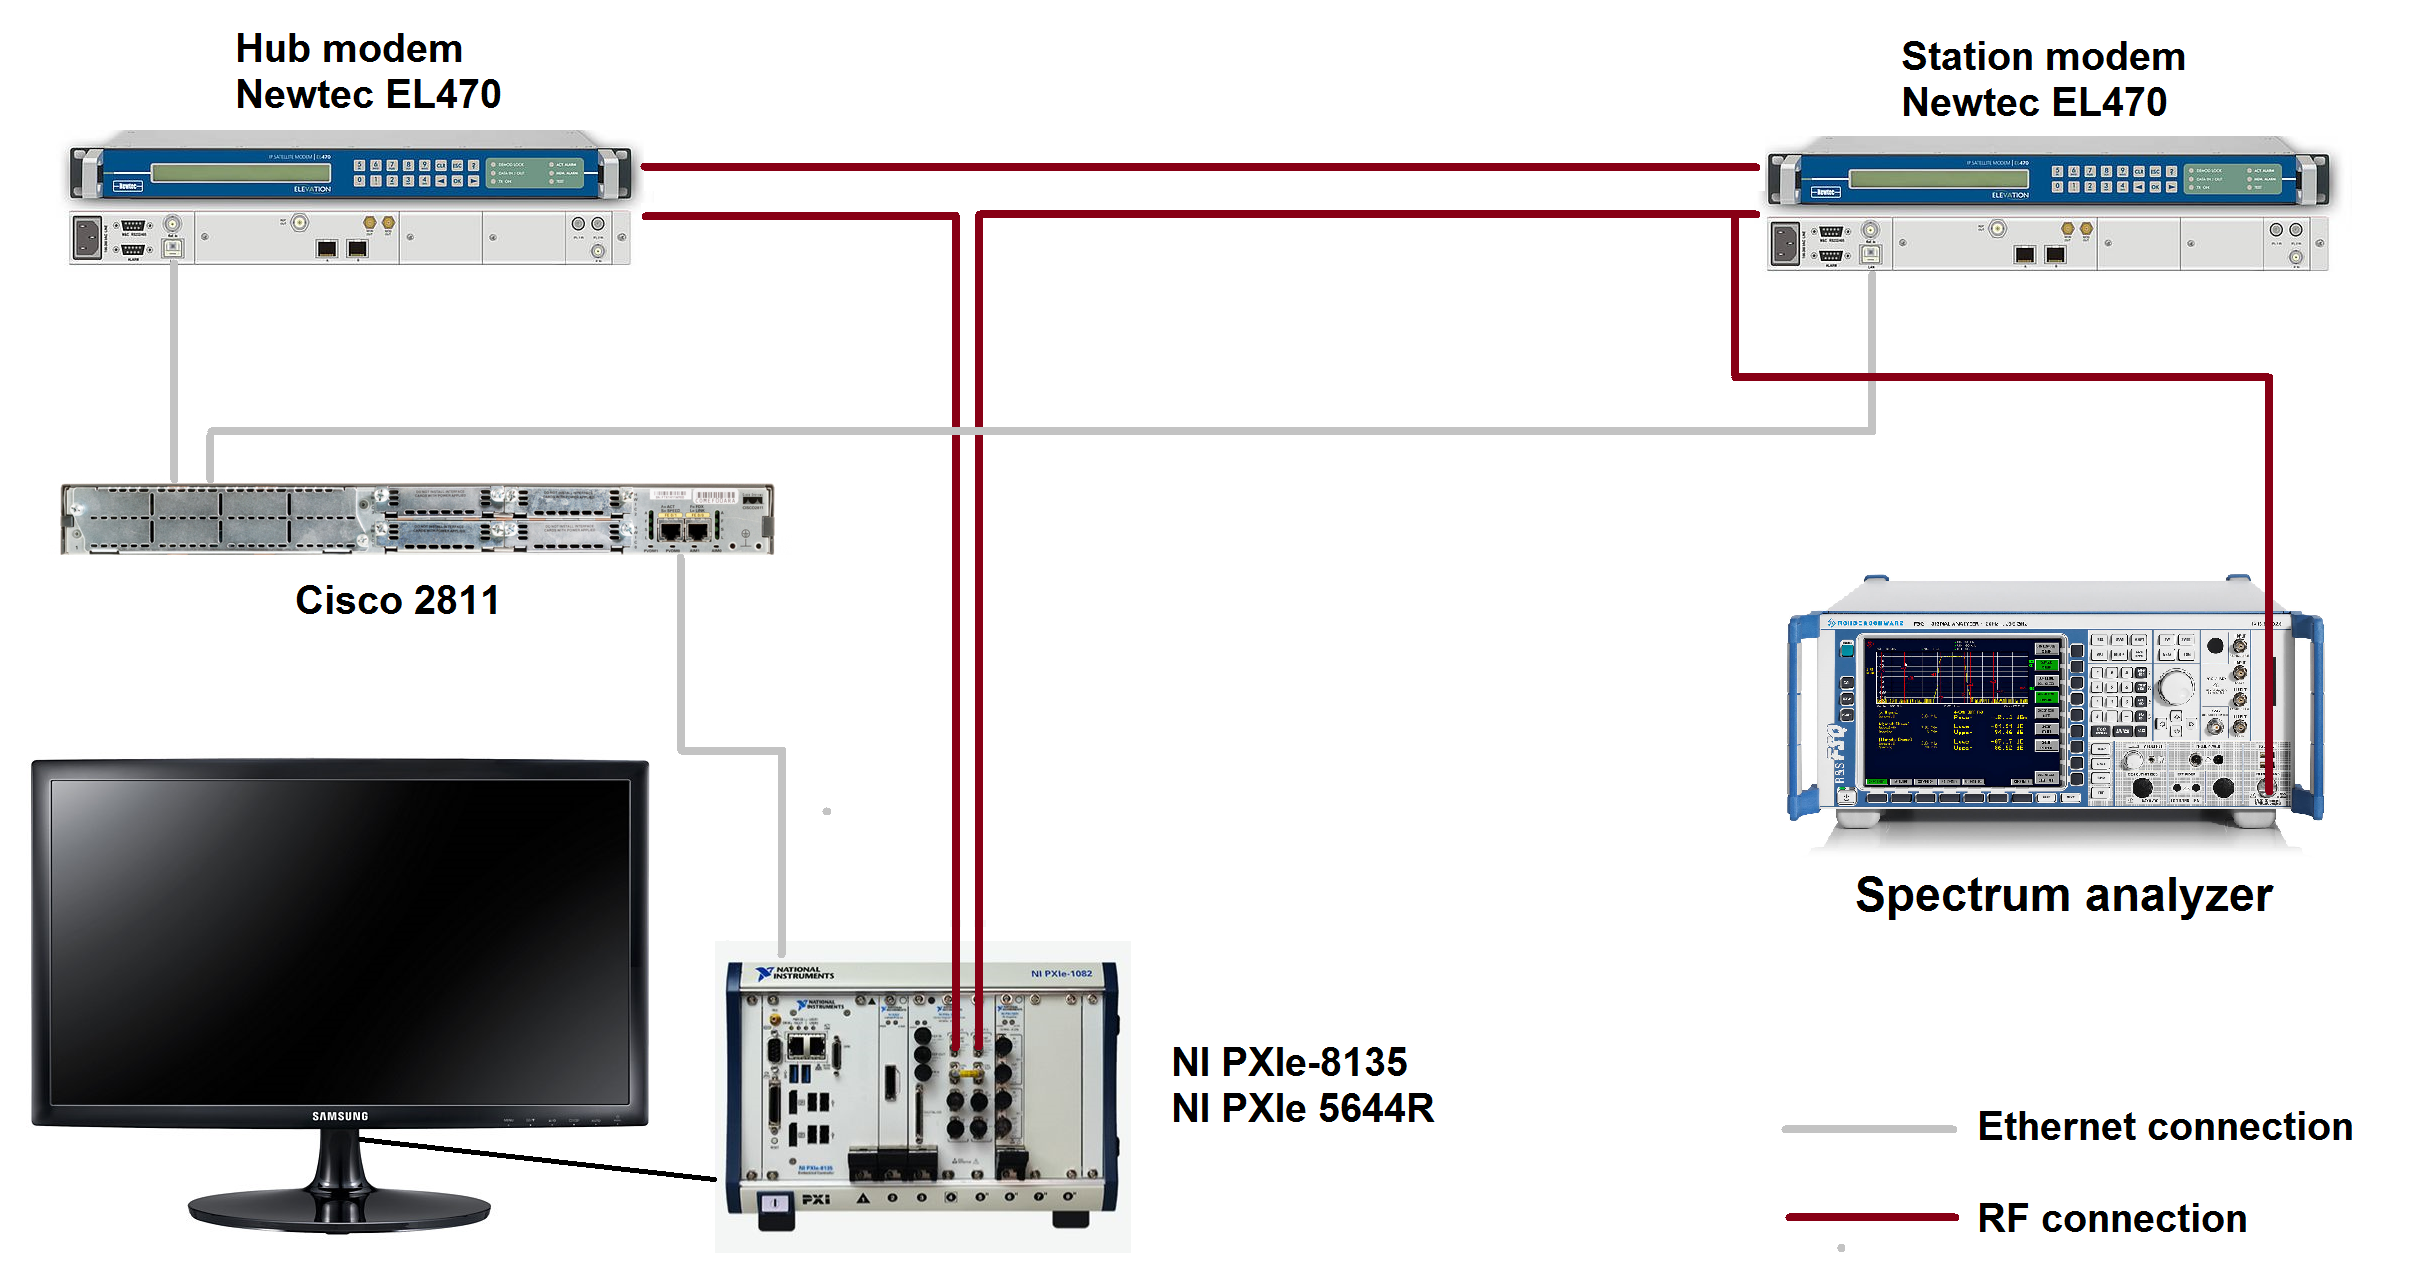
Figure 1. Test bench used to measure Eb/No
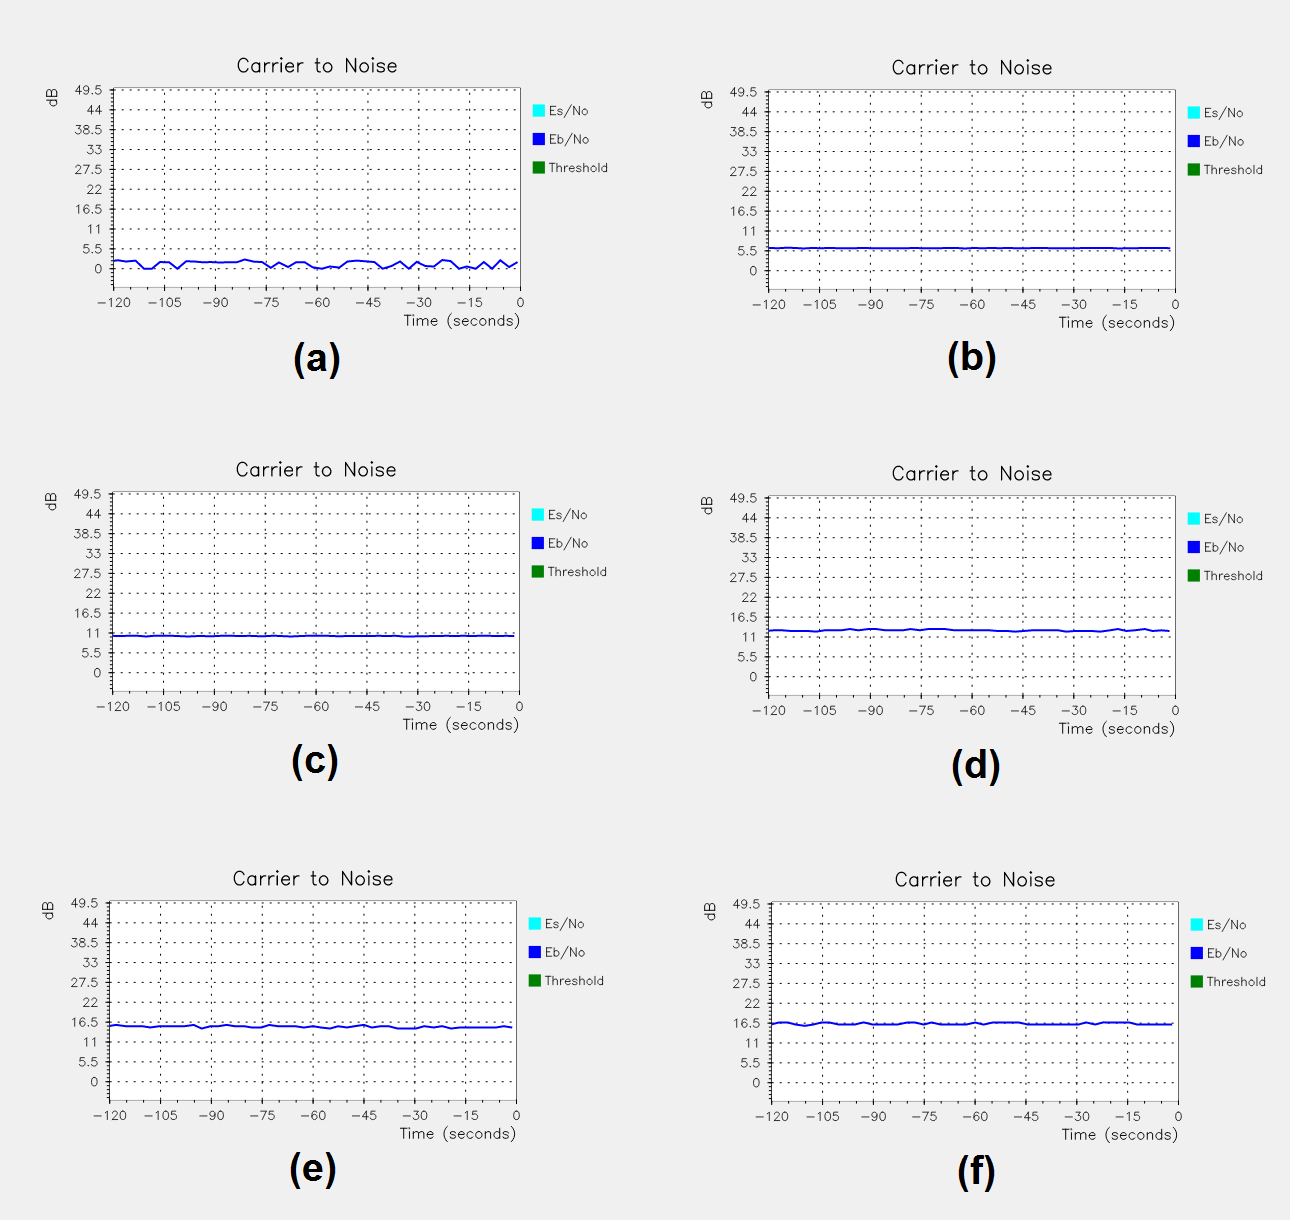
Figure 2. Eb/No measurements obtained from the modem interface
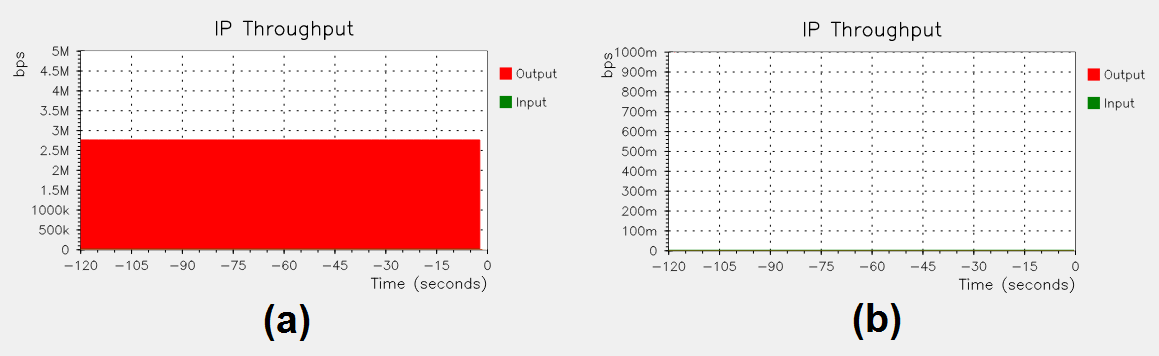
Figure 3. IP throughput for 5 dB and 0 dB
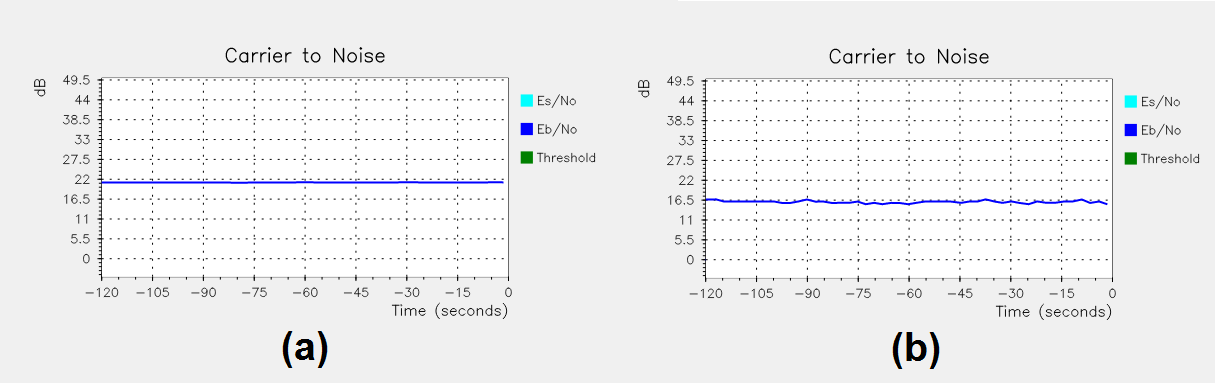
Figure 4. Eb/No degradation introduced by the emulator
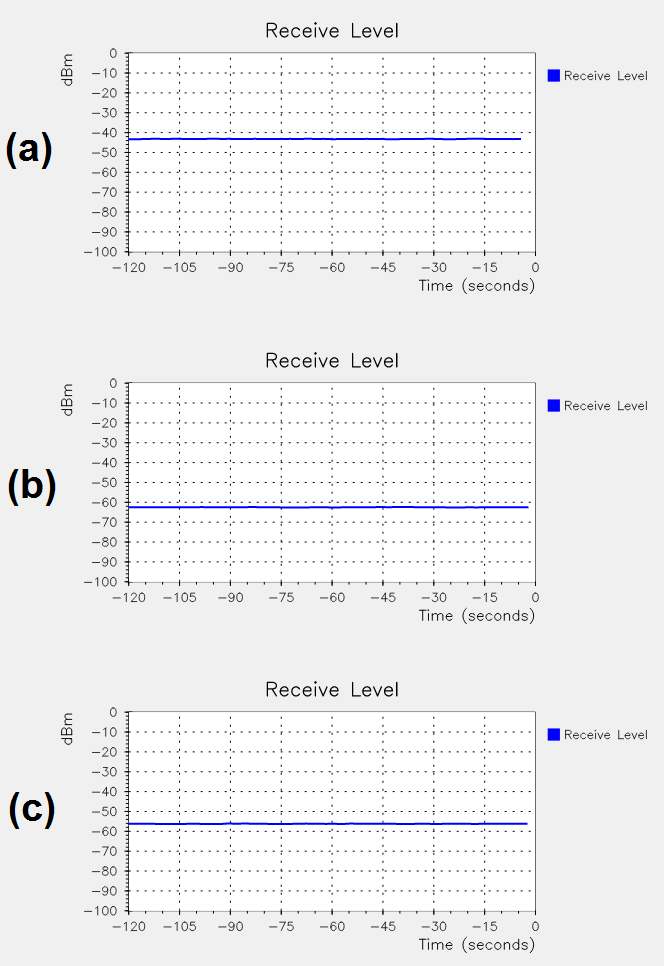
Figure 5. Output power degradation introduced by the emulator
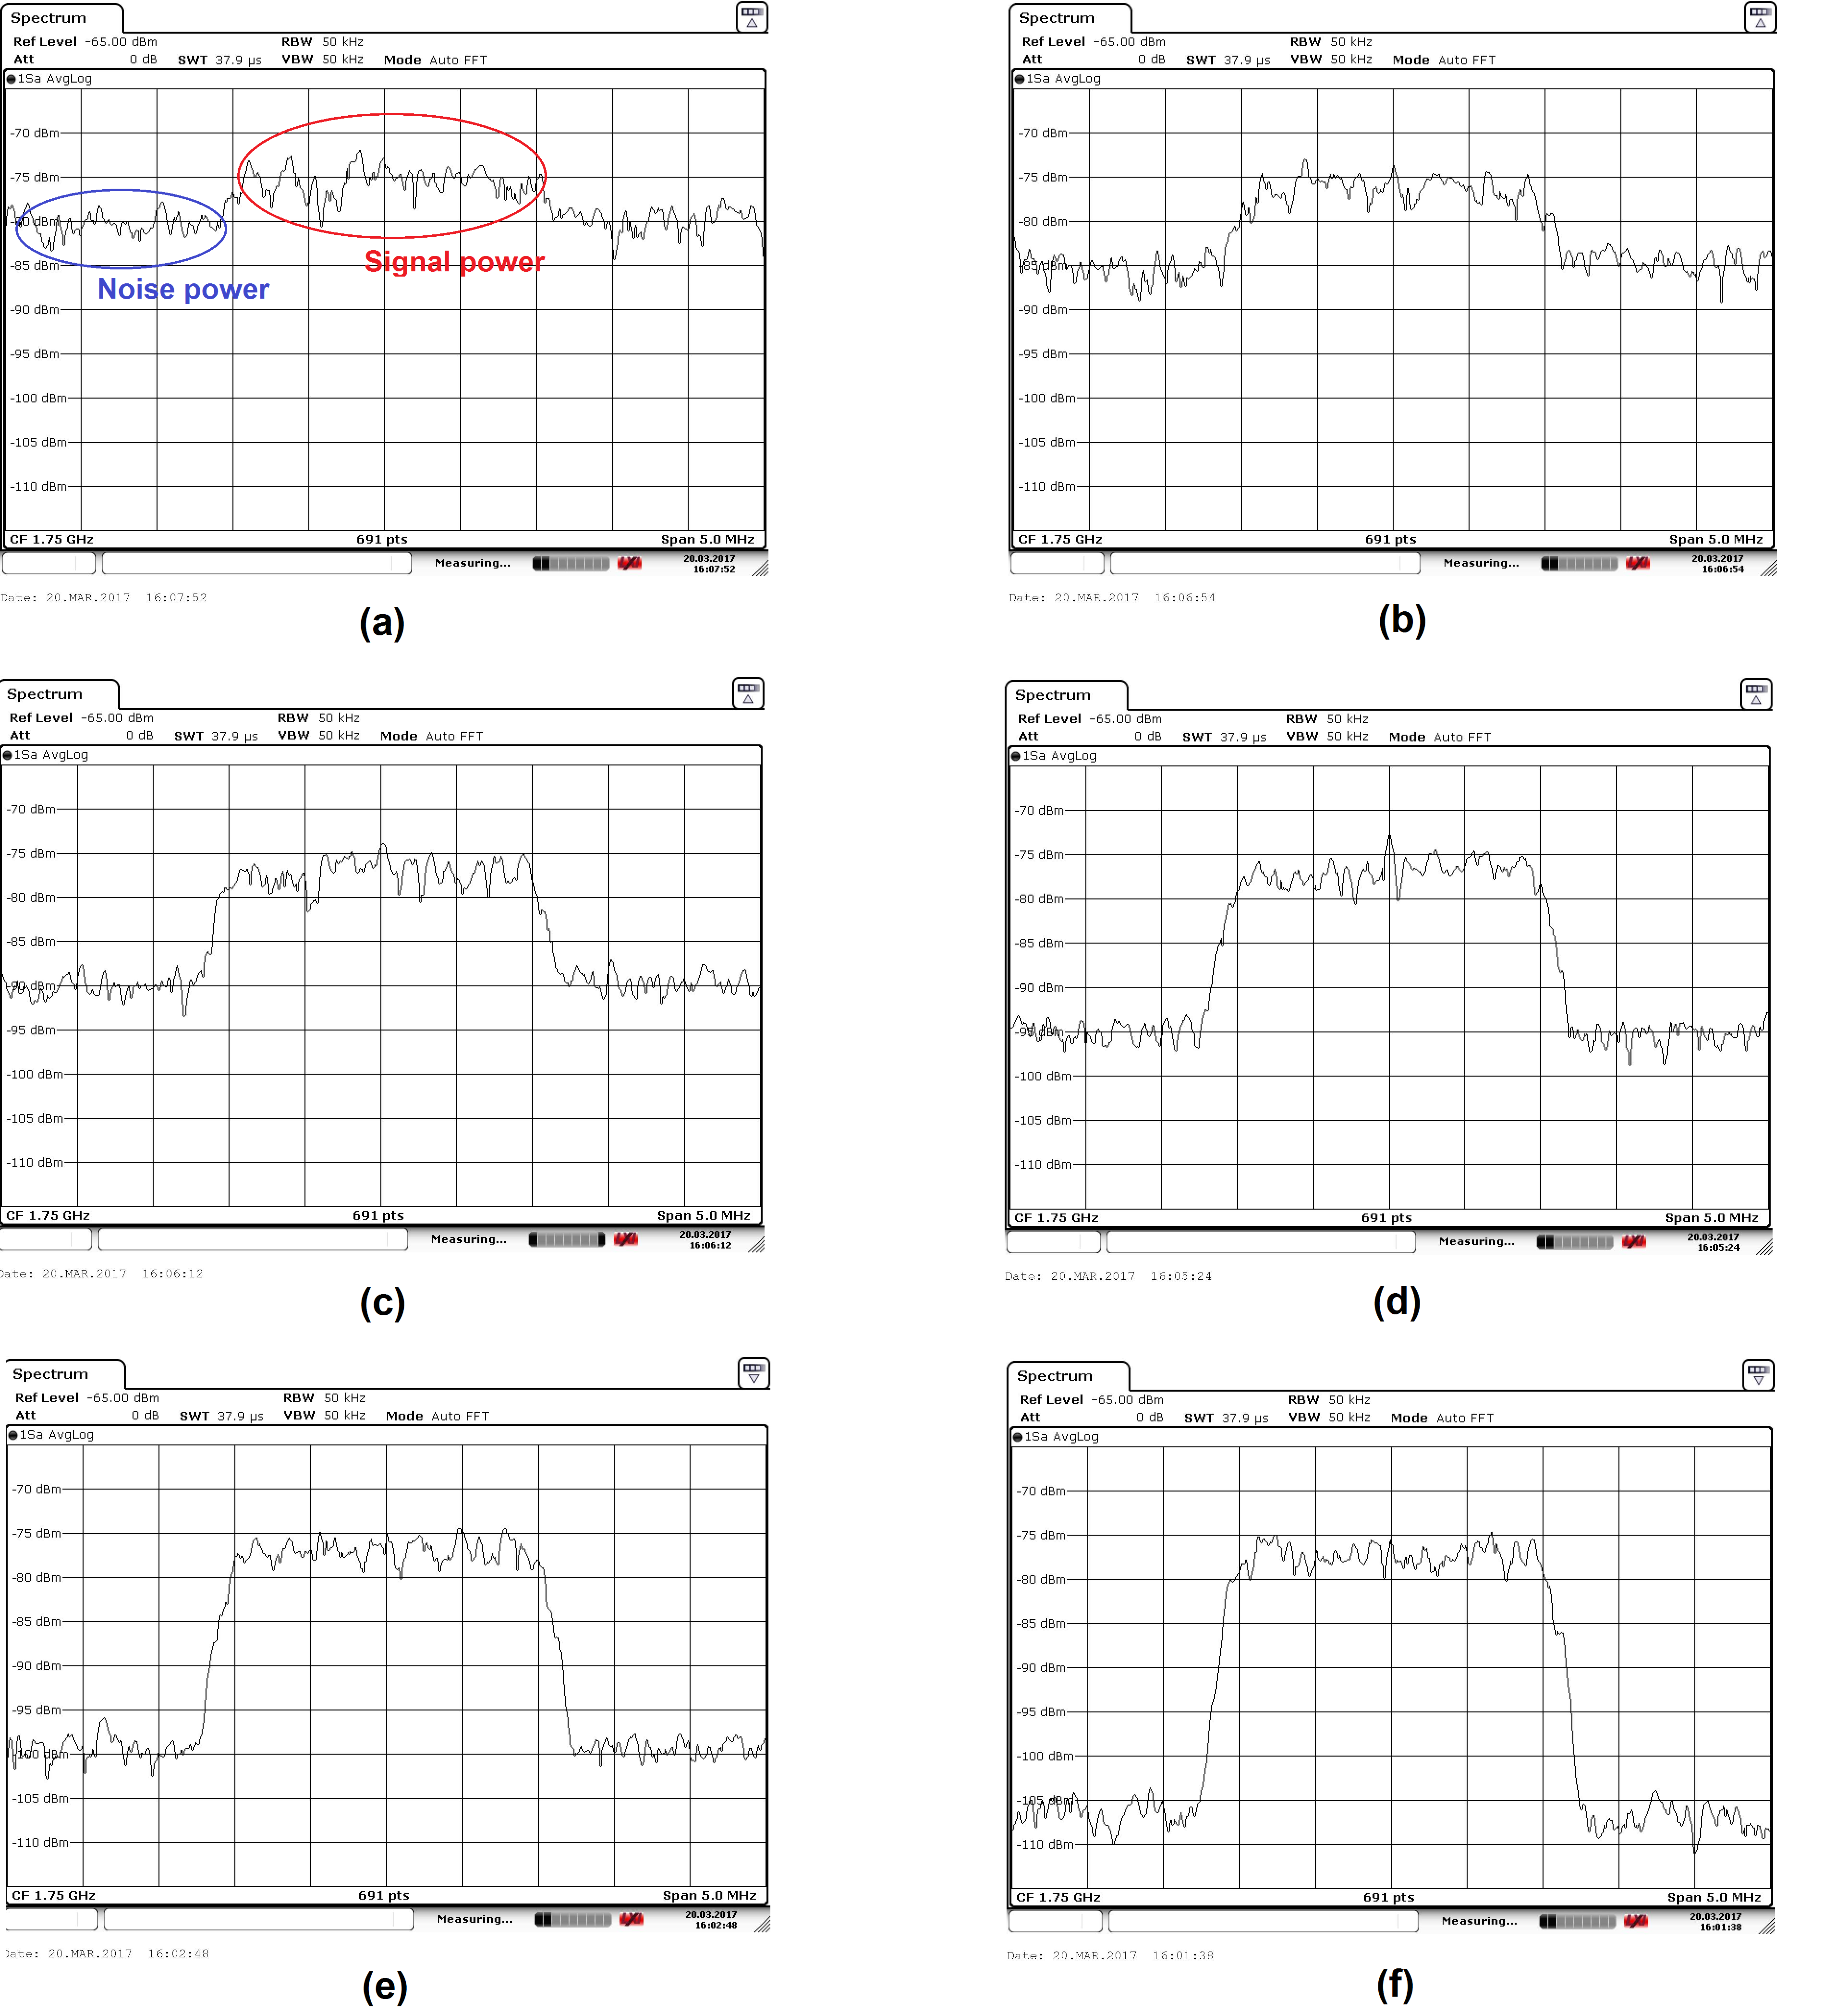
Figure 6. Signal-to-noise power measurements carried out with the spectrum analyzer
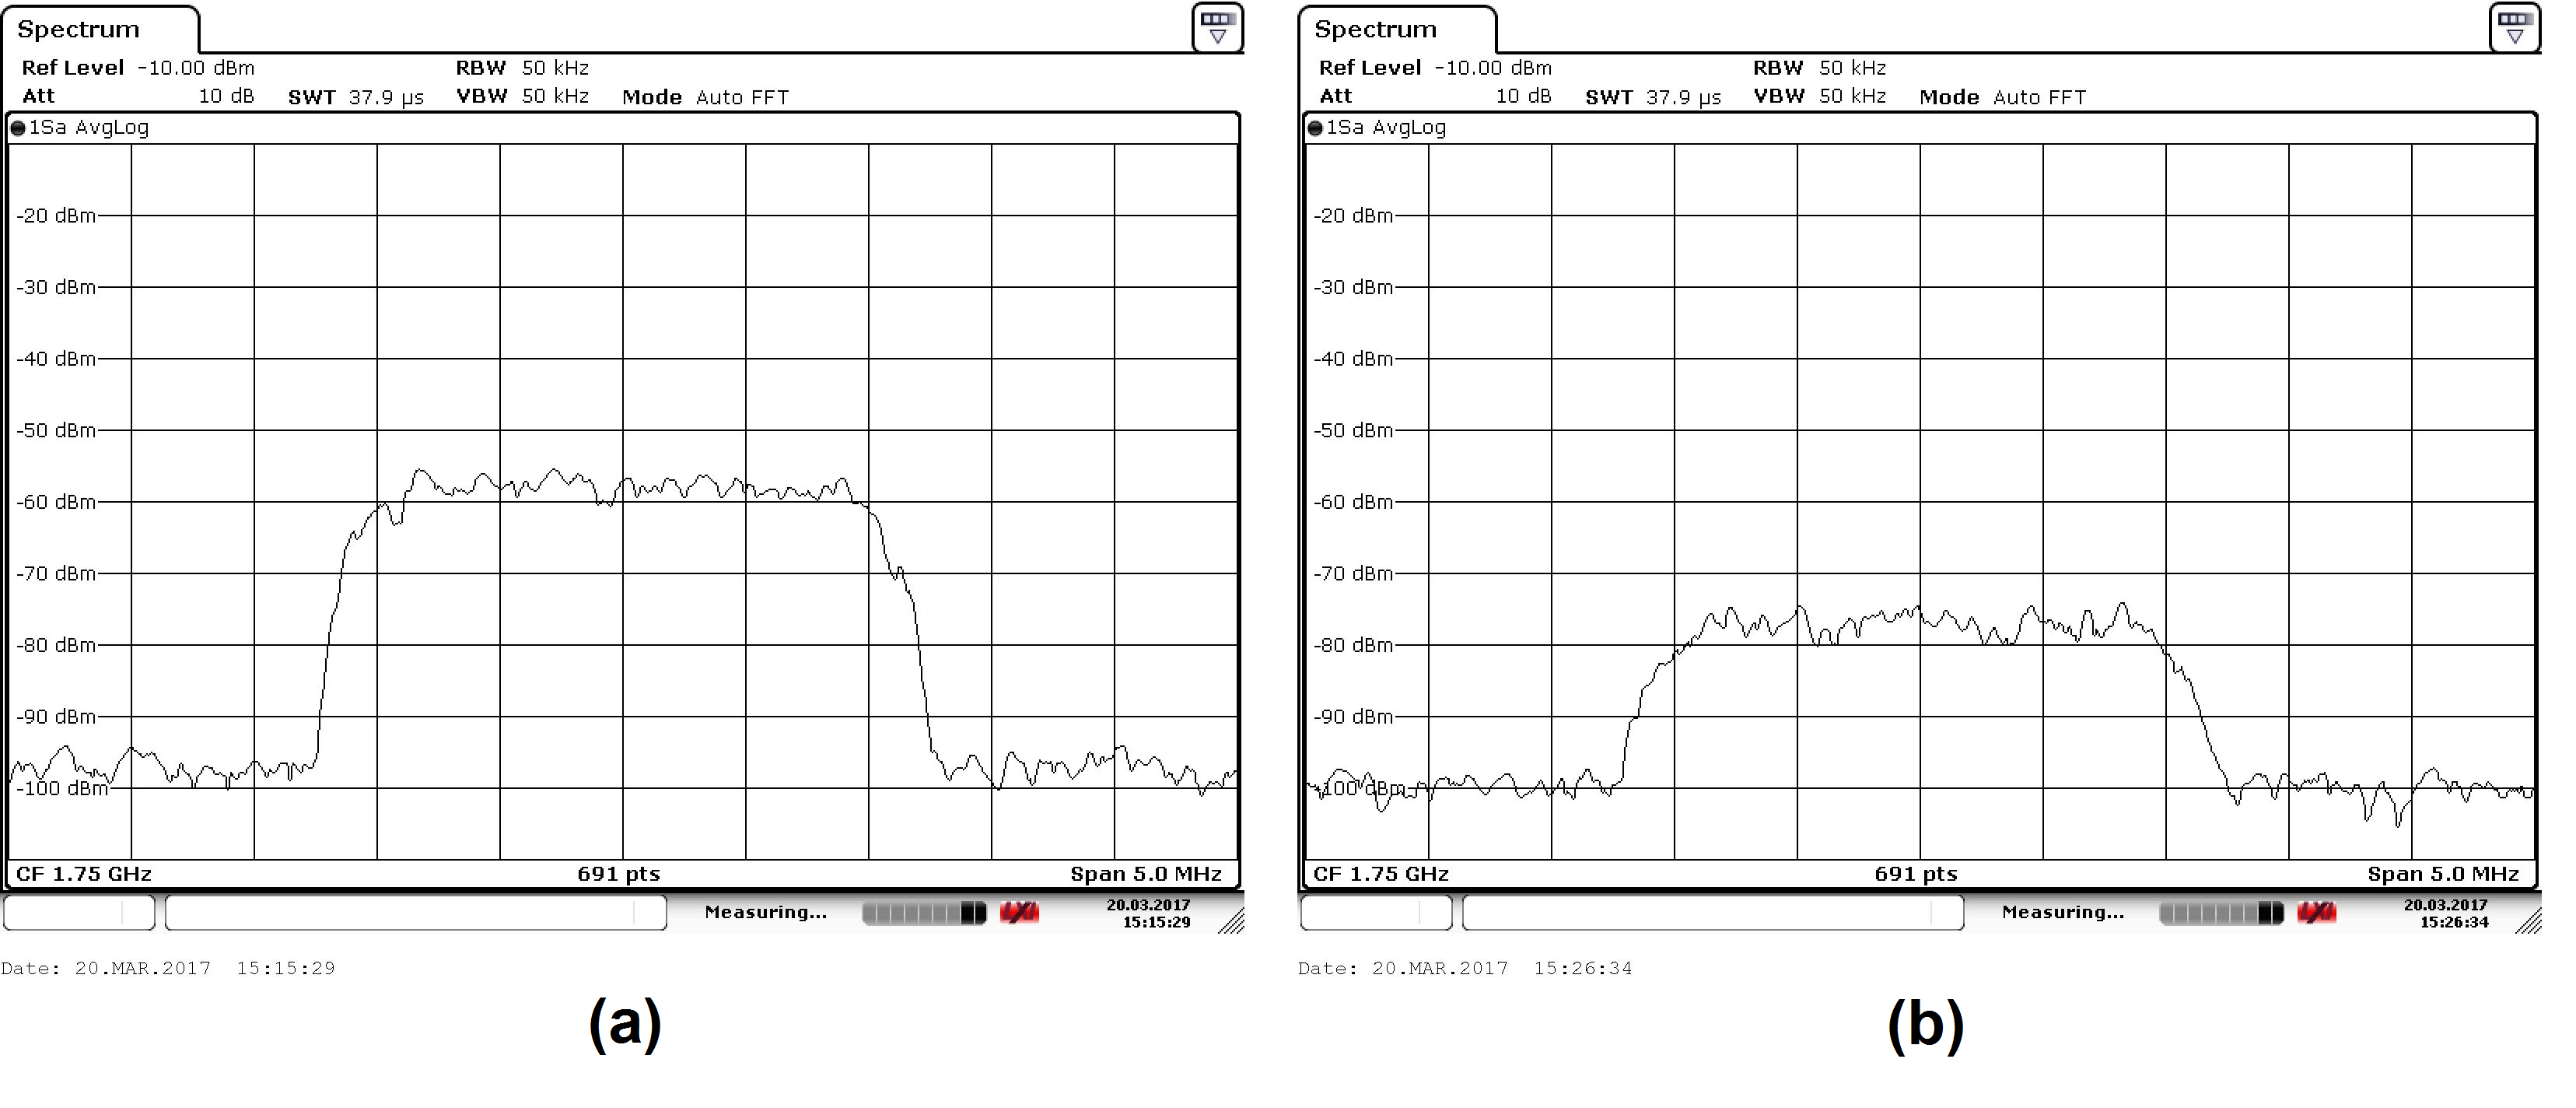
Figure 7. Signal power degradation due to the emulator
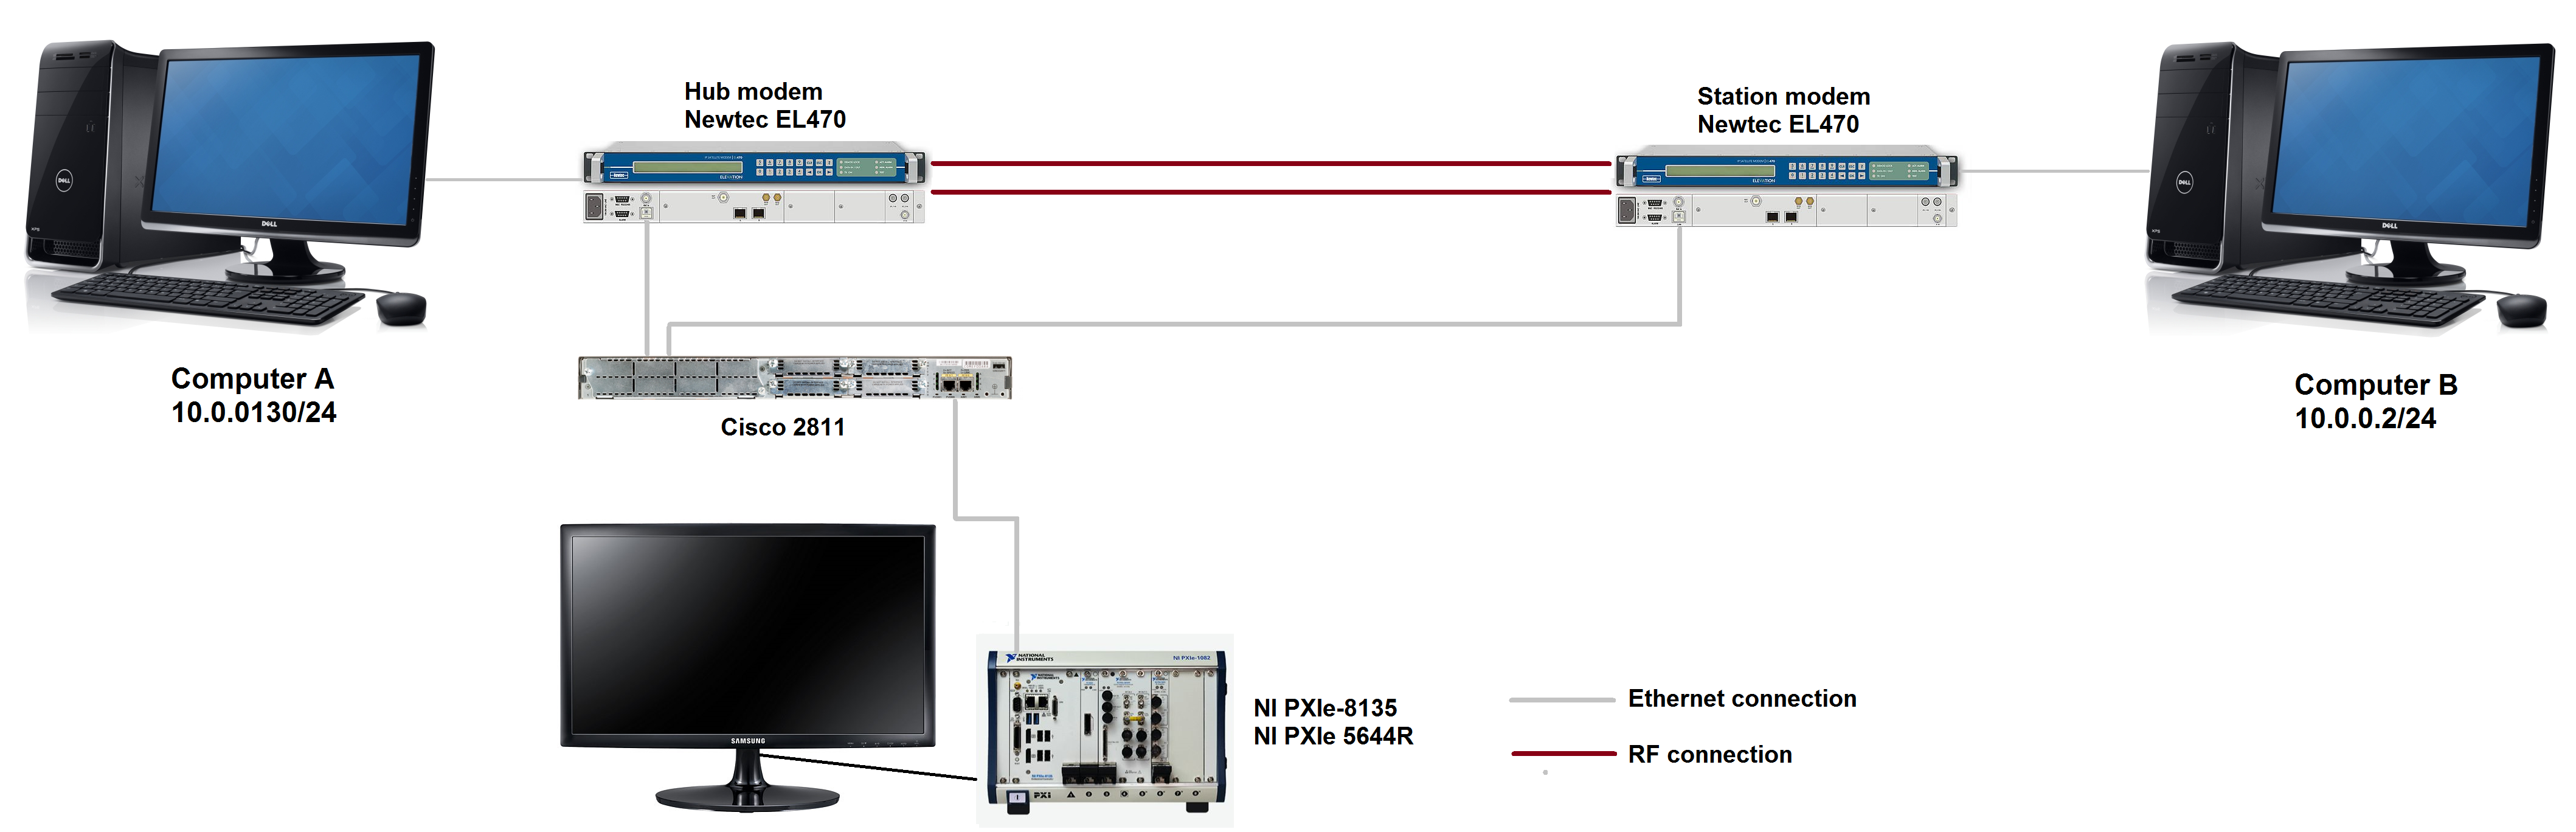
Figure 8. Test bench used to measure a reference round trip time
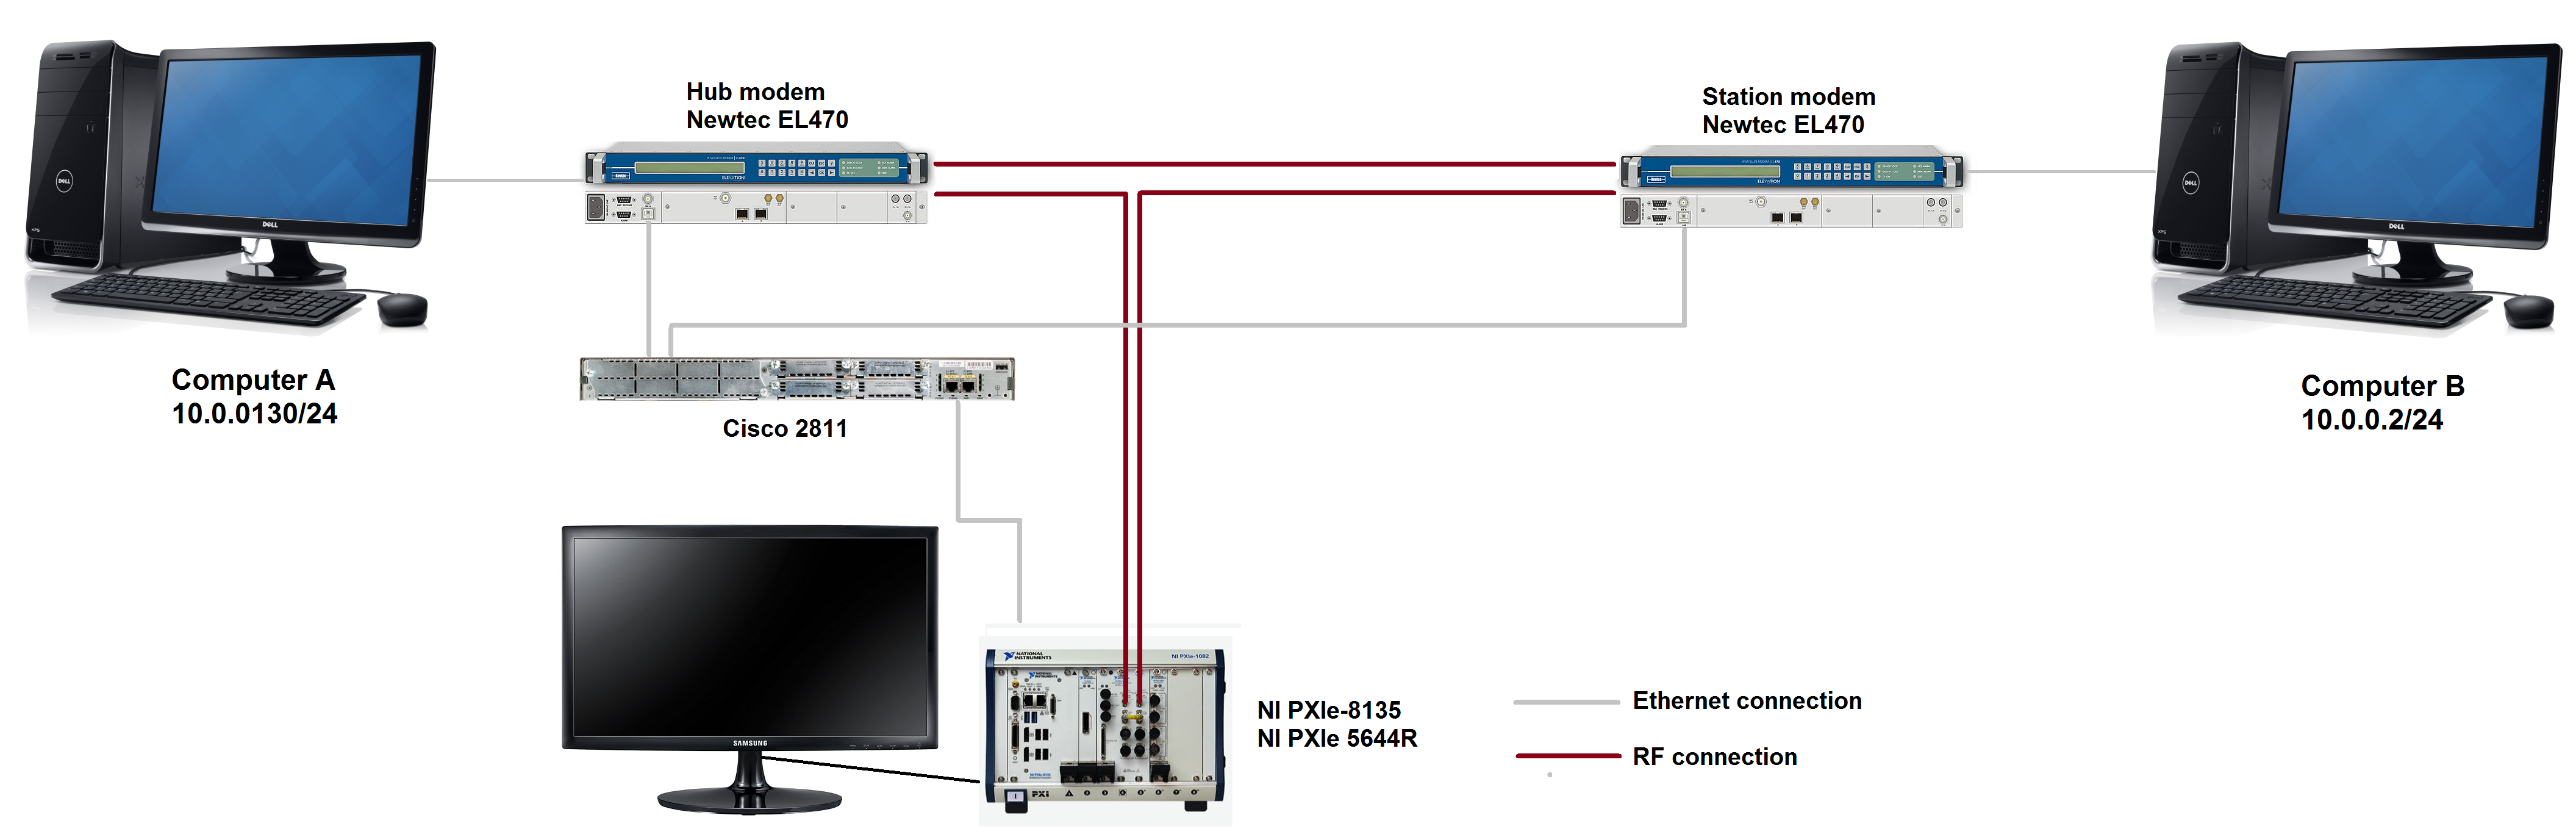
Figure 9. Test bench used to measure the total round trip time
!{width:50%} Total_delay_without_emulator.png!
Figure 10. Round trip time measurements using the ping command (10 packets of 1B and 1500B, respectively) when the emulator is not connected
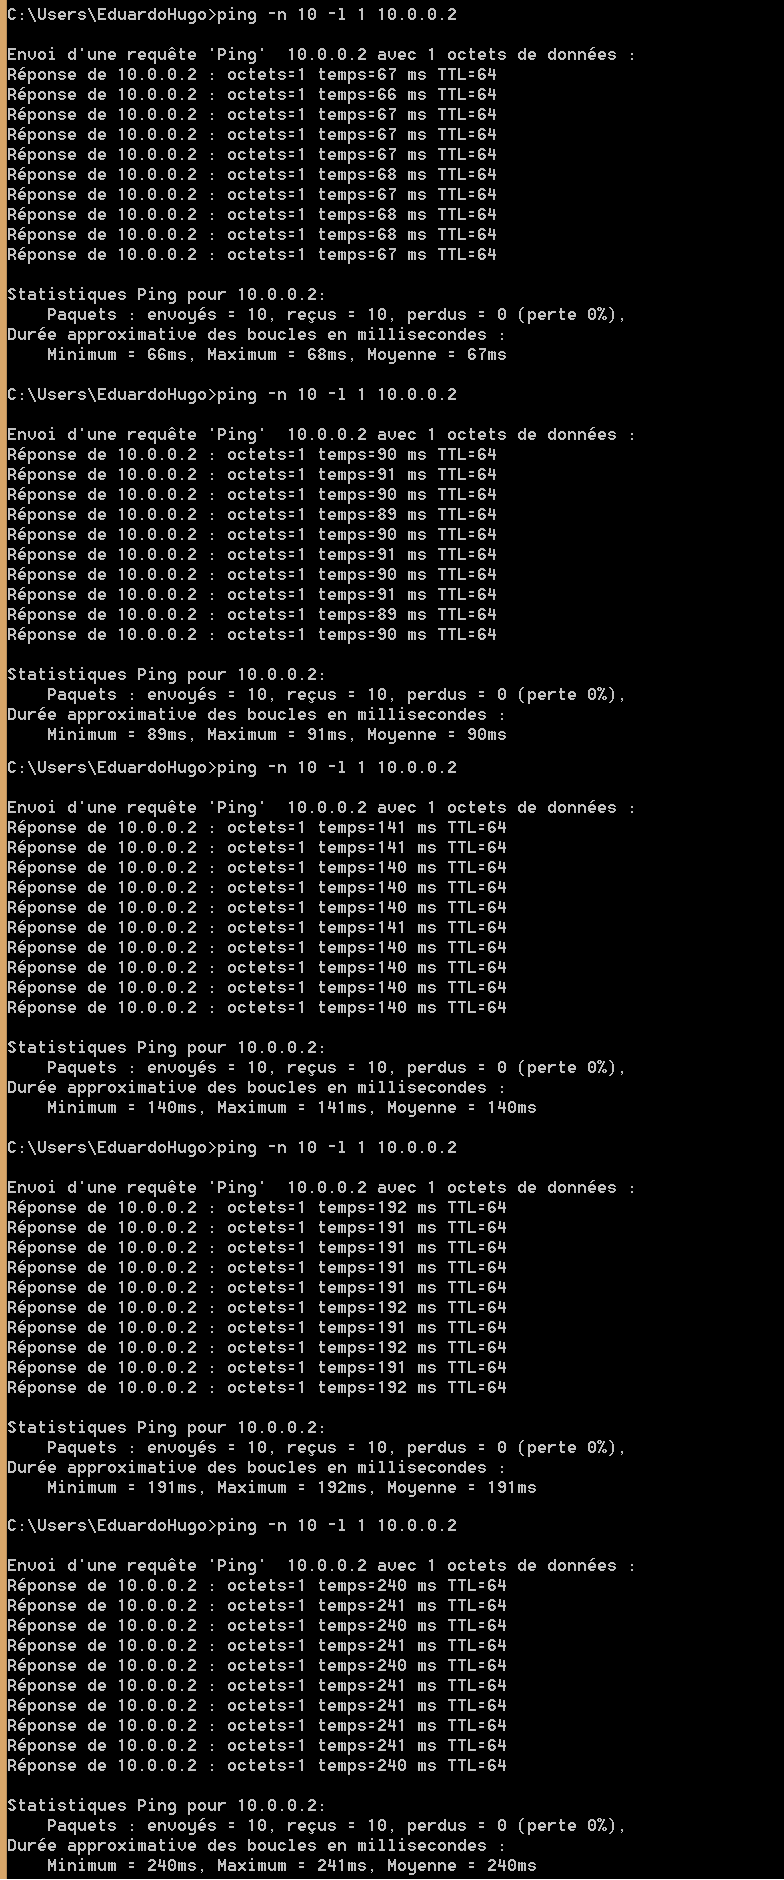
Figure 11. Round trip time measurements using the ping command (10 packets of 1B) when the emulator is connected for different delays values
!{width:50%} Delay050100150200_1500bytes.png!
Figure 12. Round trip time measurements using the ping command (10 packets of 1500B) when the emulator is connected for different delays values