
Test and results » History » Version 5
« Previous -
Version 5/19
(diff) -
Next » -
Current version
SANCHEZ, Eduardo, 03/26/2017 11:29 AM
Performance analysis and results
Several tests are carried out in order to evaluate the performance of the developed channel emulator. Firstly, it must be verified that the required Eb/No level is achieved at the demodulator output. Secondly, the time delay of transmitted packets must be measured to guarantee compliance with the specified delay.
Noise measurements
Consider the test bench shown in Figure 1 in order to measure Eb/No level during the transmission. The hub modem sends a QPSK modulated signal to the station modem through the satellite channel represented by the VST. Then, the channel-applied signal is received at the demodulator input of the station modem where the Eb/No measurement is performed. The carrier-to-noise power can be obtained in two different ways by using the monitoring tools of the modem or the spectrum analyzer.
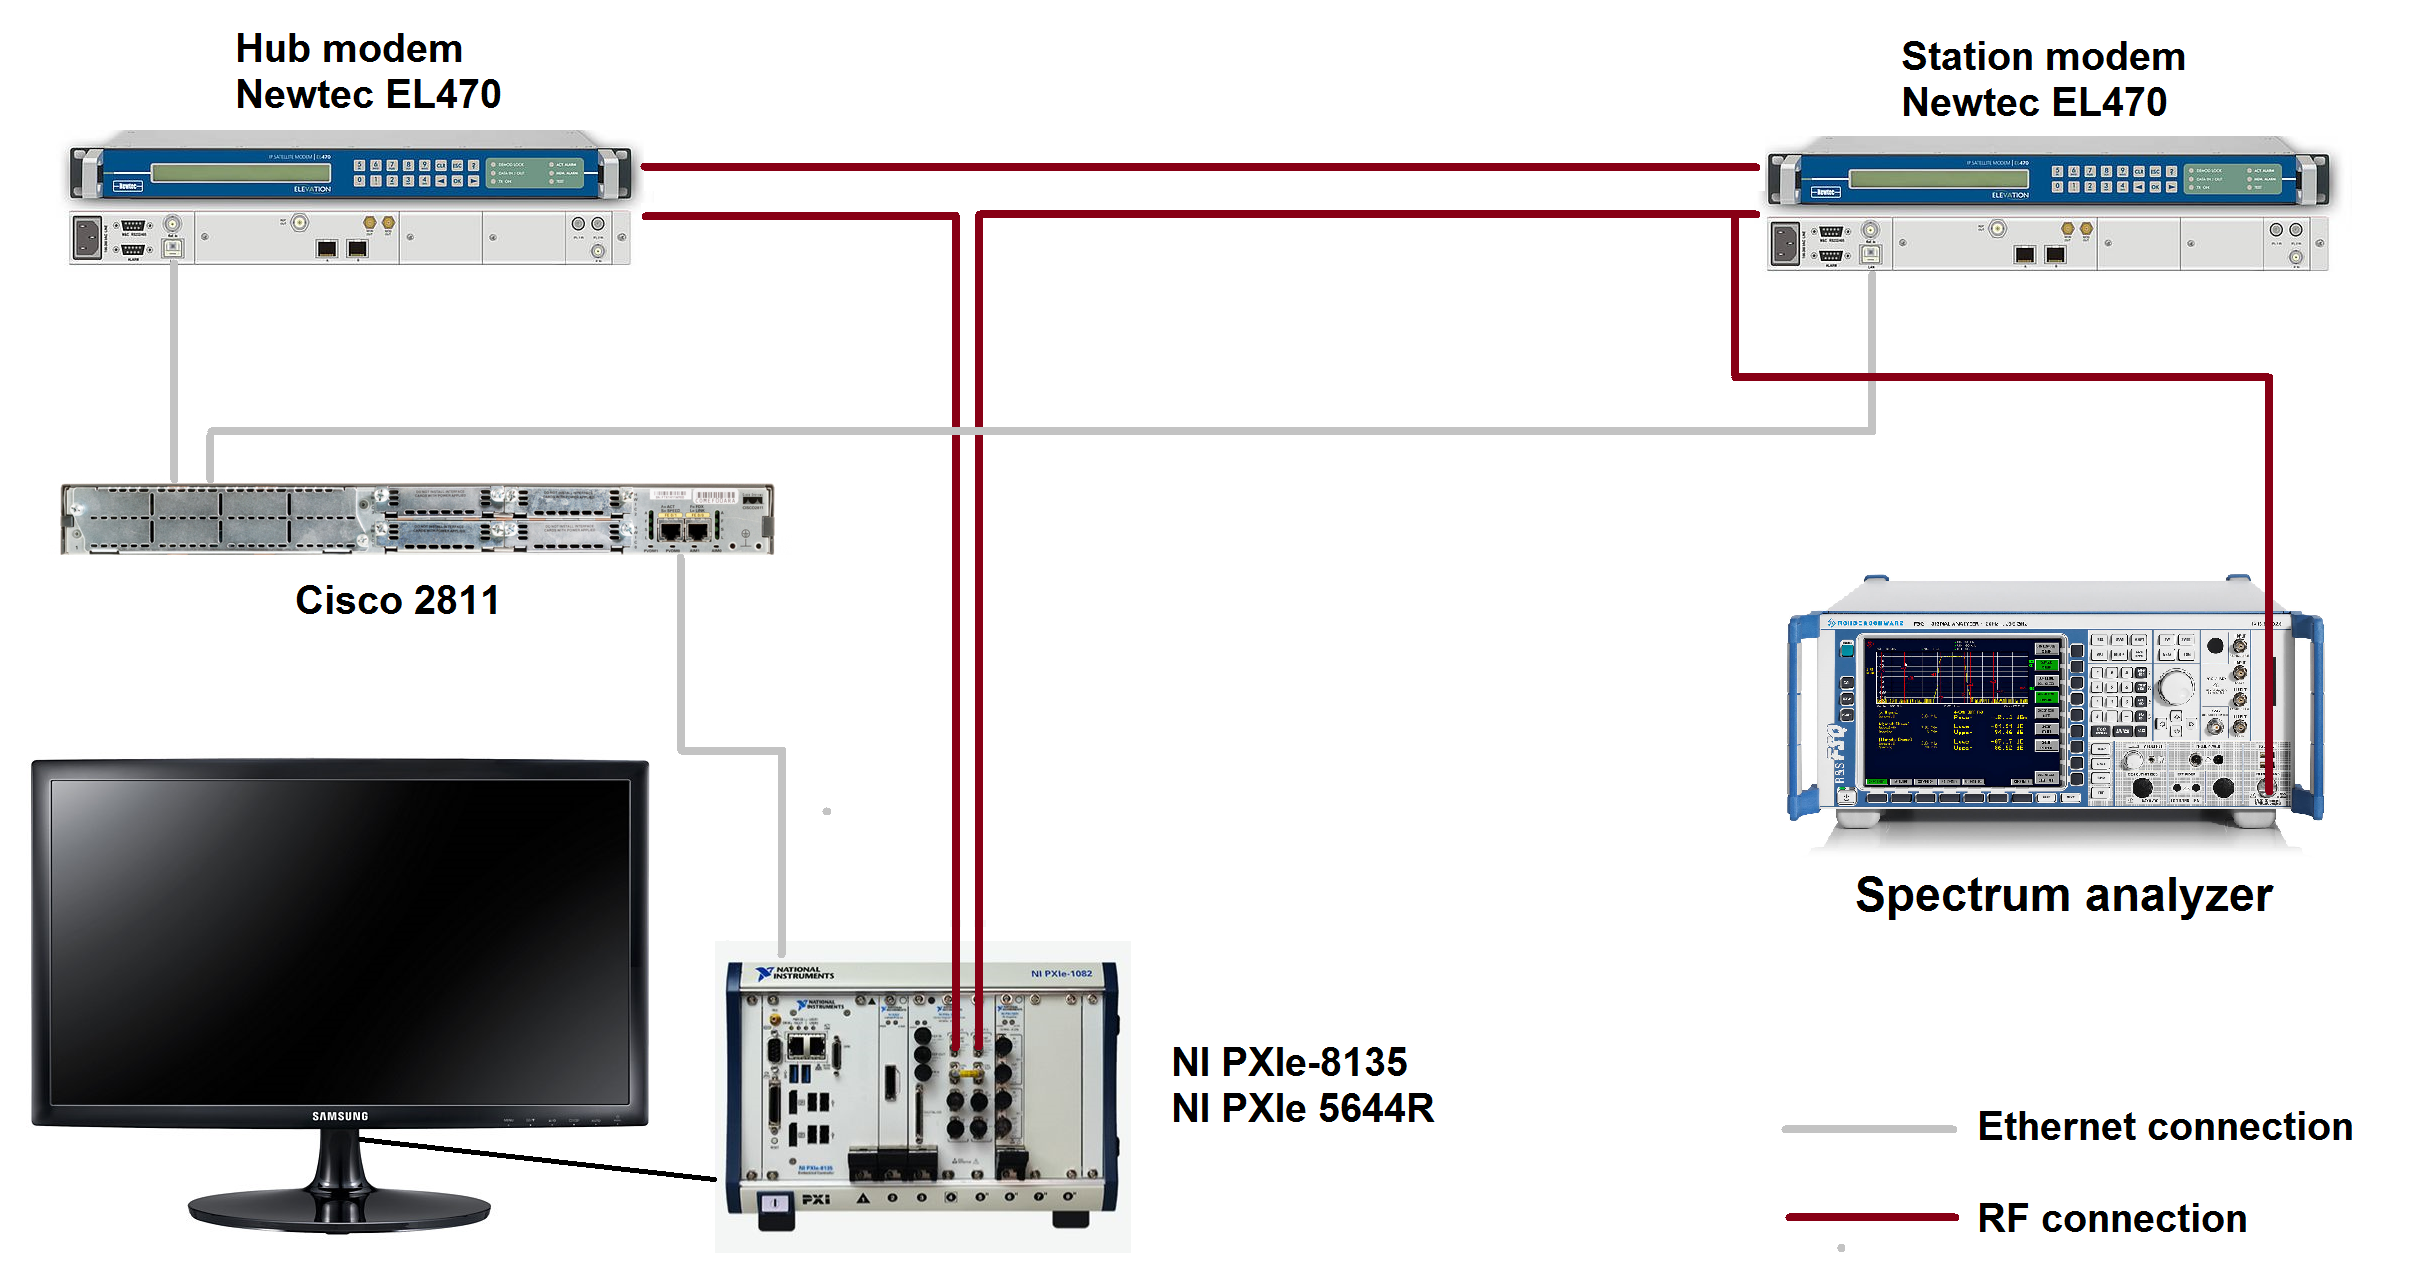
Figure 1. Test bench used to measure Eb/No
A first approach consist of using the monitoring tools included in the modem configuration interface. Figure 2 shows the measured carrier-to-noise power over 2 minutes for 0 dB, 5 dB, 10 dB, 15 dB, 20 dB and 50 dB. As can be observed the obtained values are approximately the same as the selected Eb/No values in the front panel of the emulator. It can be noticed that for 0 dB, the demodulator is not capable to demodulate the QPSK signal and recover the received IP packets as shown in Figure 3 where the IP throughput for 5 dB and 0 dB are plotted.
Furthermore, as can be seen in Figures 2(e) and 2(f), the obtained carrier-to-noise value is around 16.5 dB while the required Eb/No values are 20 dB and 50 dB. Therefore, it means that there is an upper bound in the Eb/No that can be generated by the channel emulator. Since the modems are connected through an active device, the noise power level is increased according to the VST noise figure and, therefore, the carrier-to-noise power is degraded.
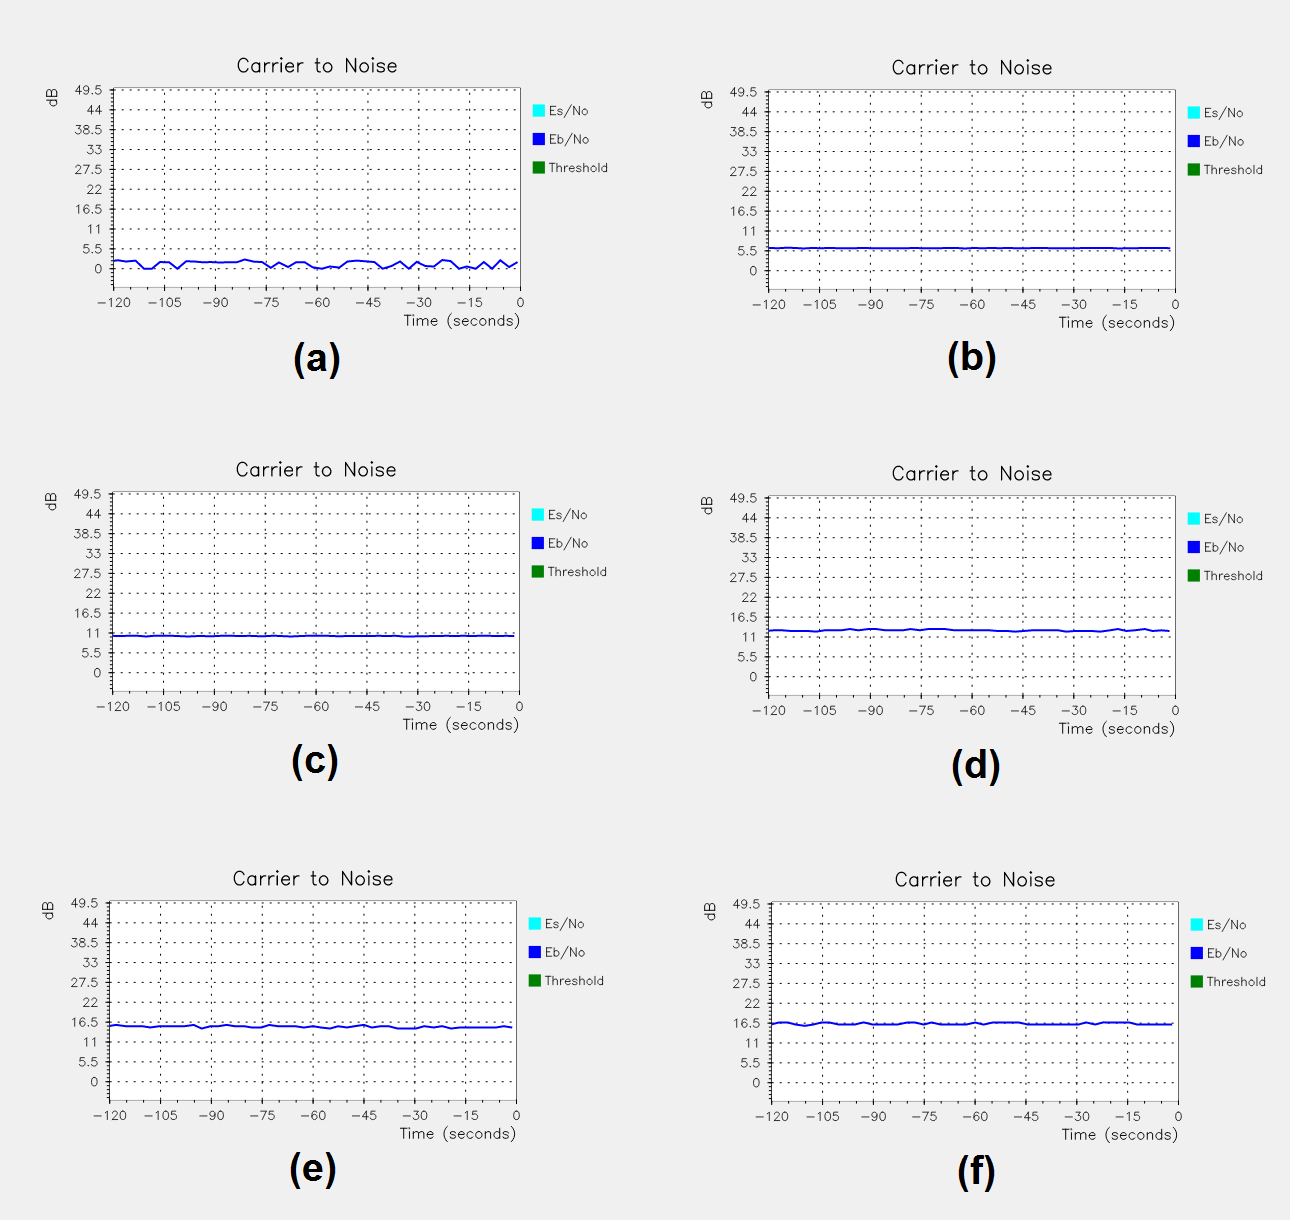
Figure 2. Eb/No measurements obtained from the modem interface. Selected Eb/No value:(a) 0 dB;(b) 5 dB;(c) 10 dB;(d) 15 dB;(e) 20 dB and (f) 50 dB
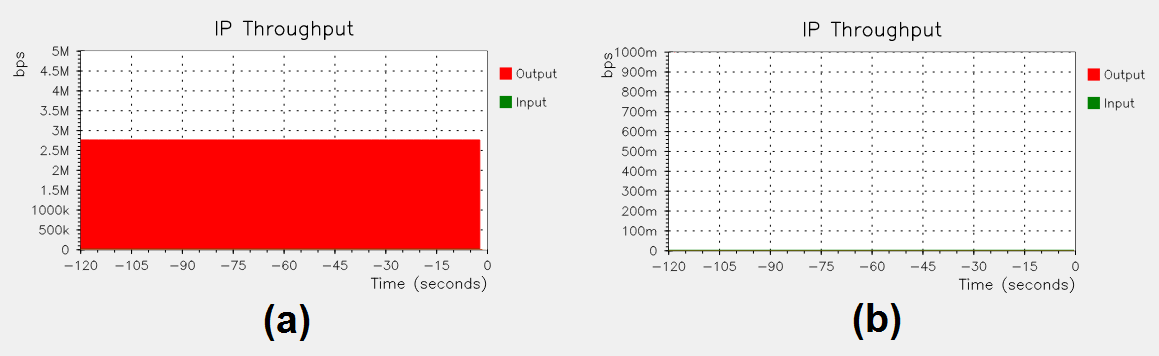
Figure 3. IP throughput for 5 dB and 0 dB
In order to explore this limitation the following experience is carried out.
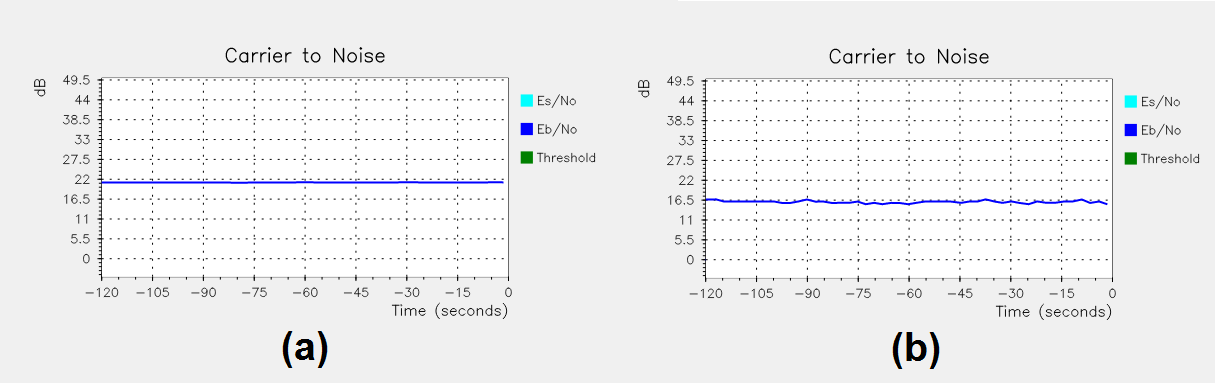
Figure 4. Eb/No degradation introduced by the emulator
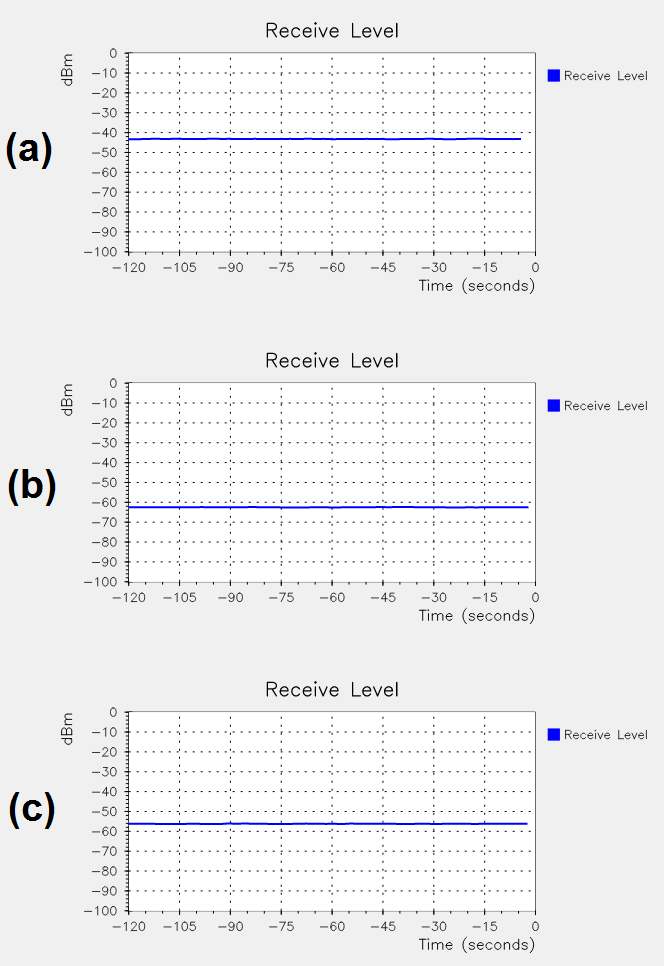
Figure 5. Output power degradation introduced by the emulator
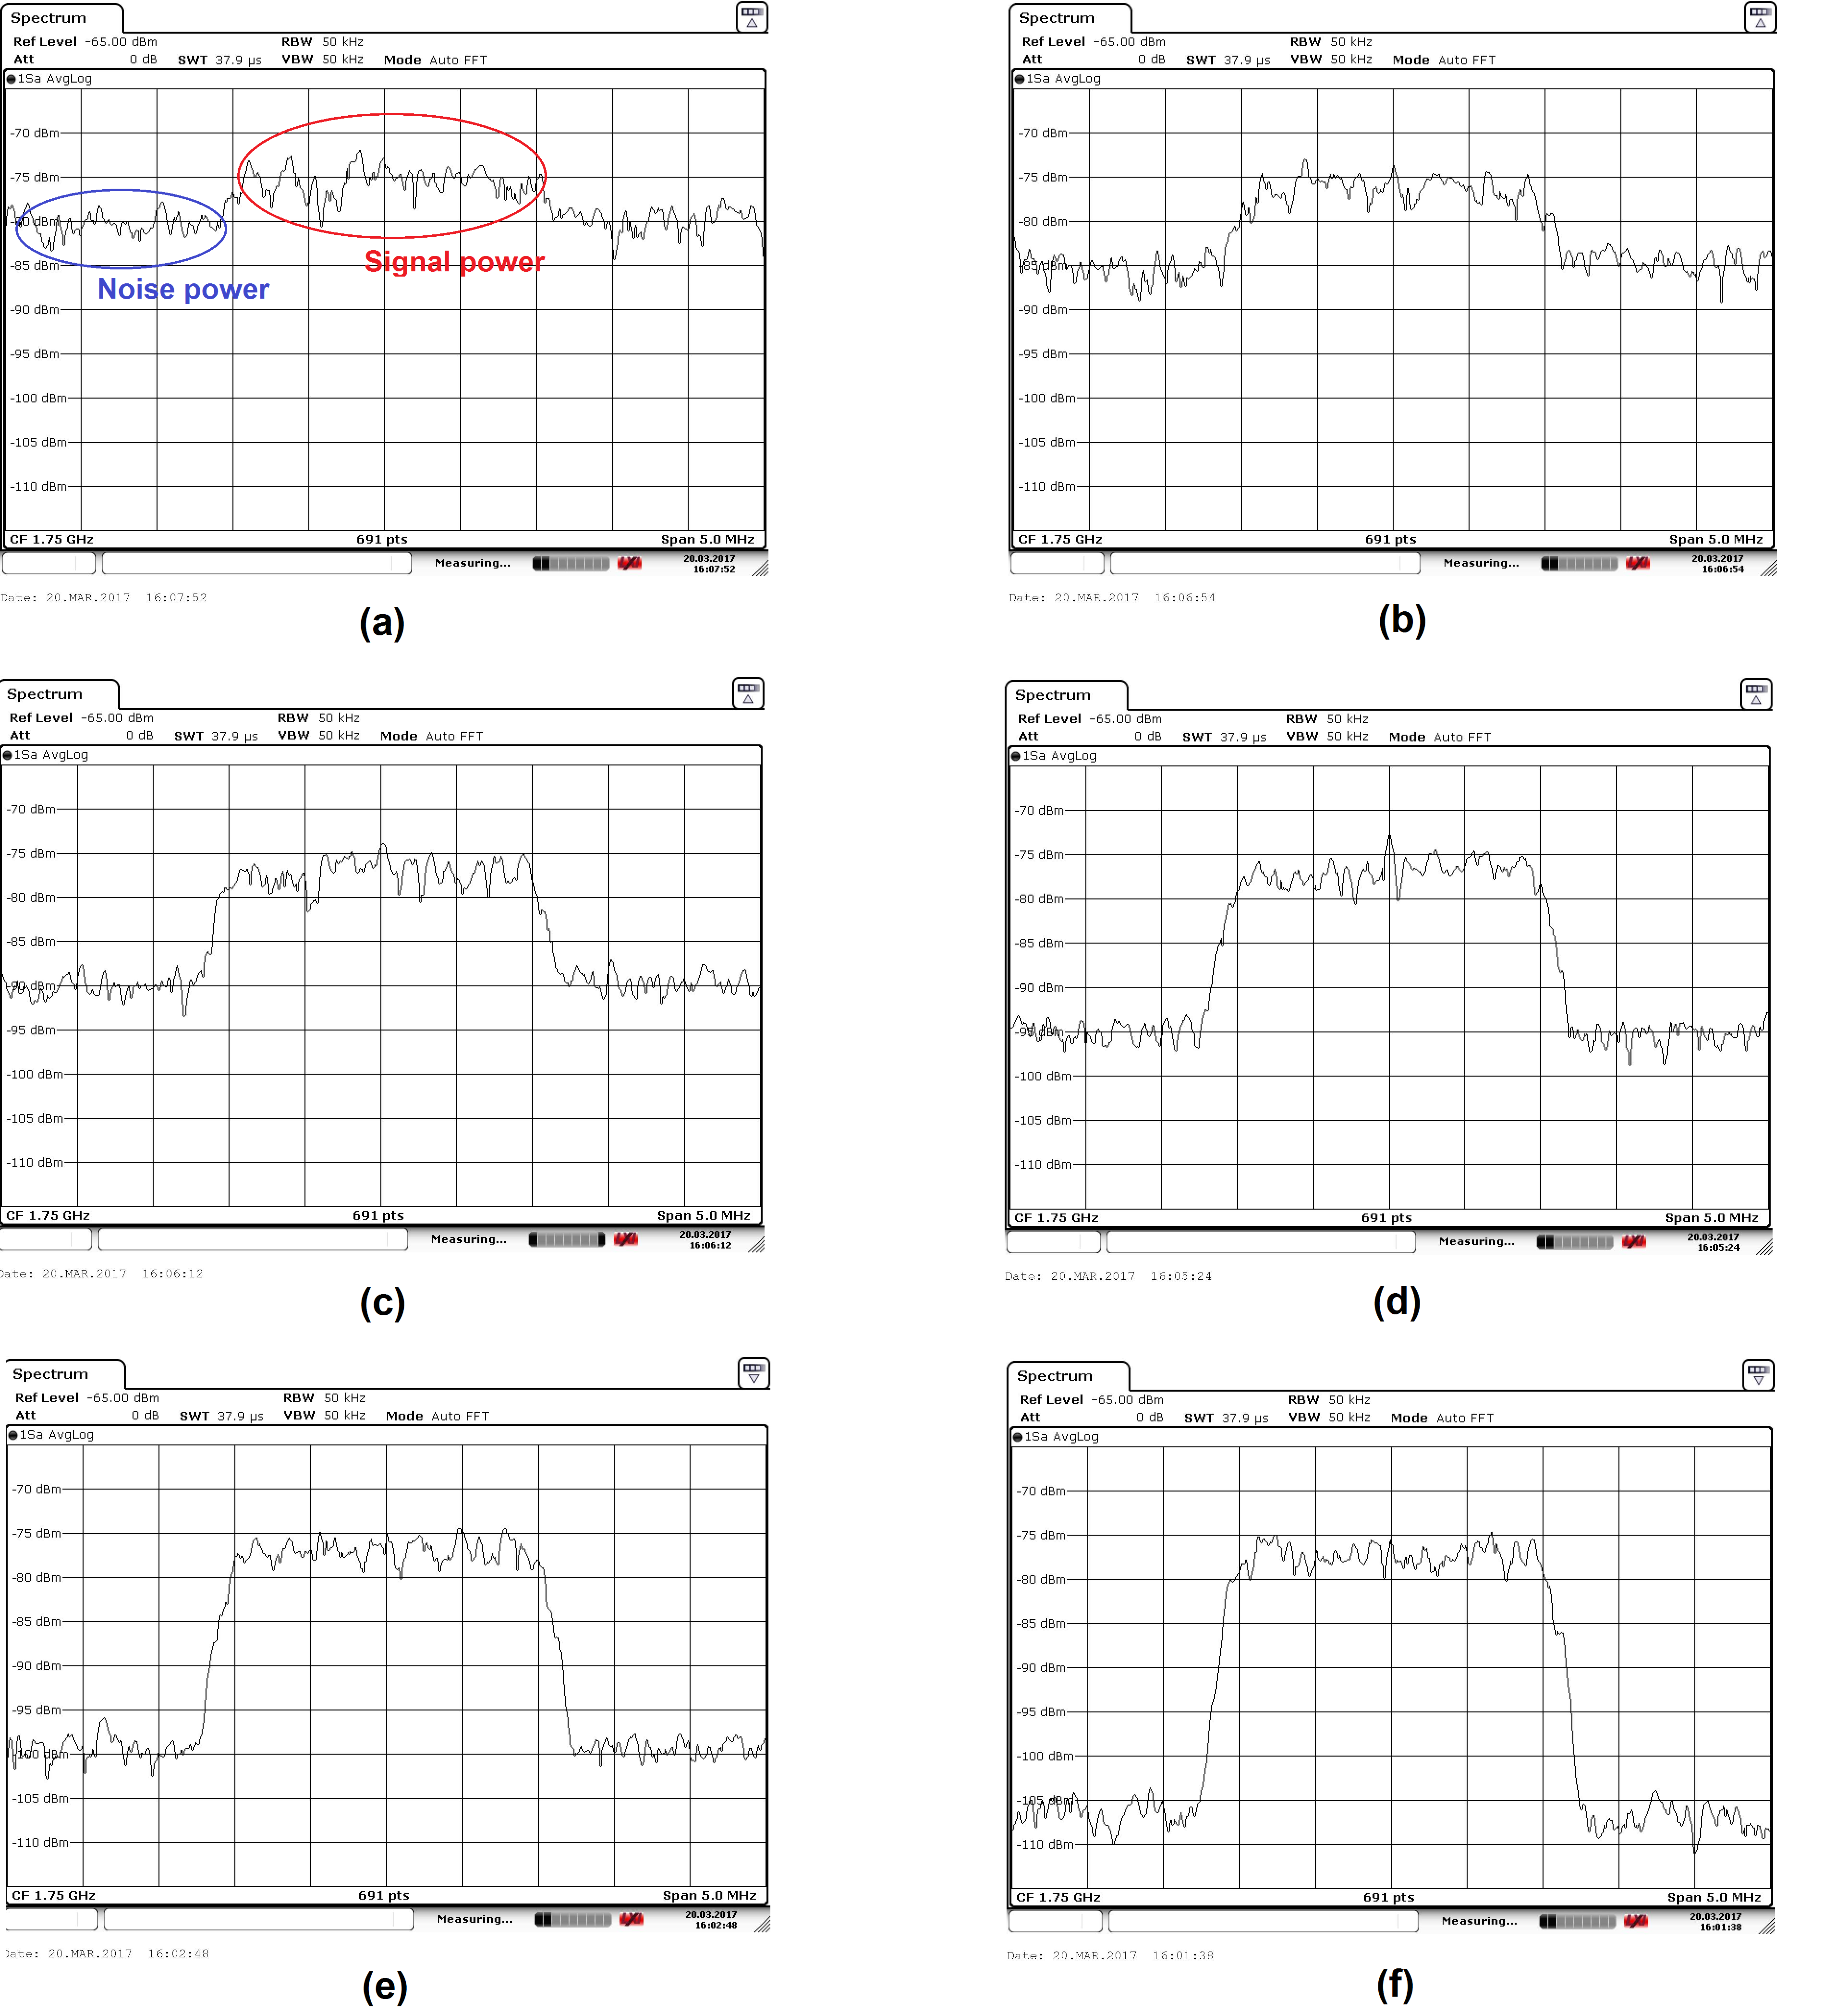
Figure 6. Signal-to-noise power measurements carried out with the spectrum analyzer
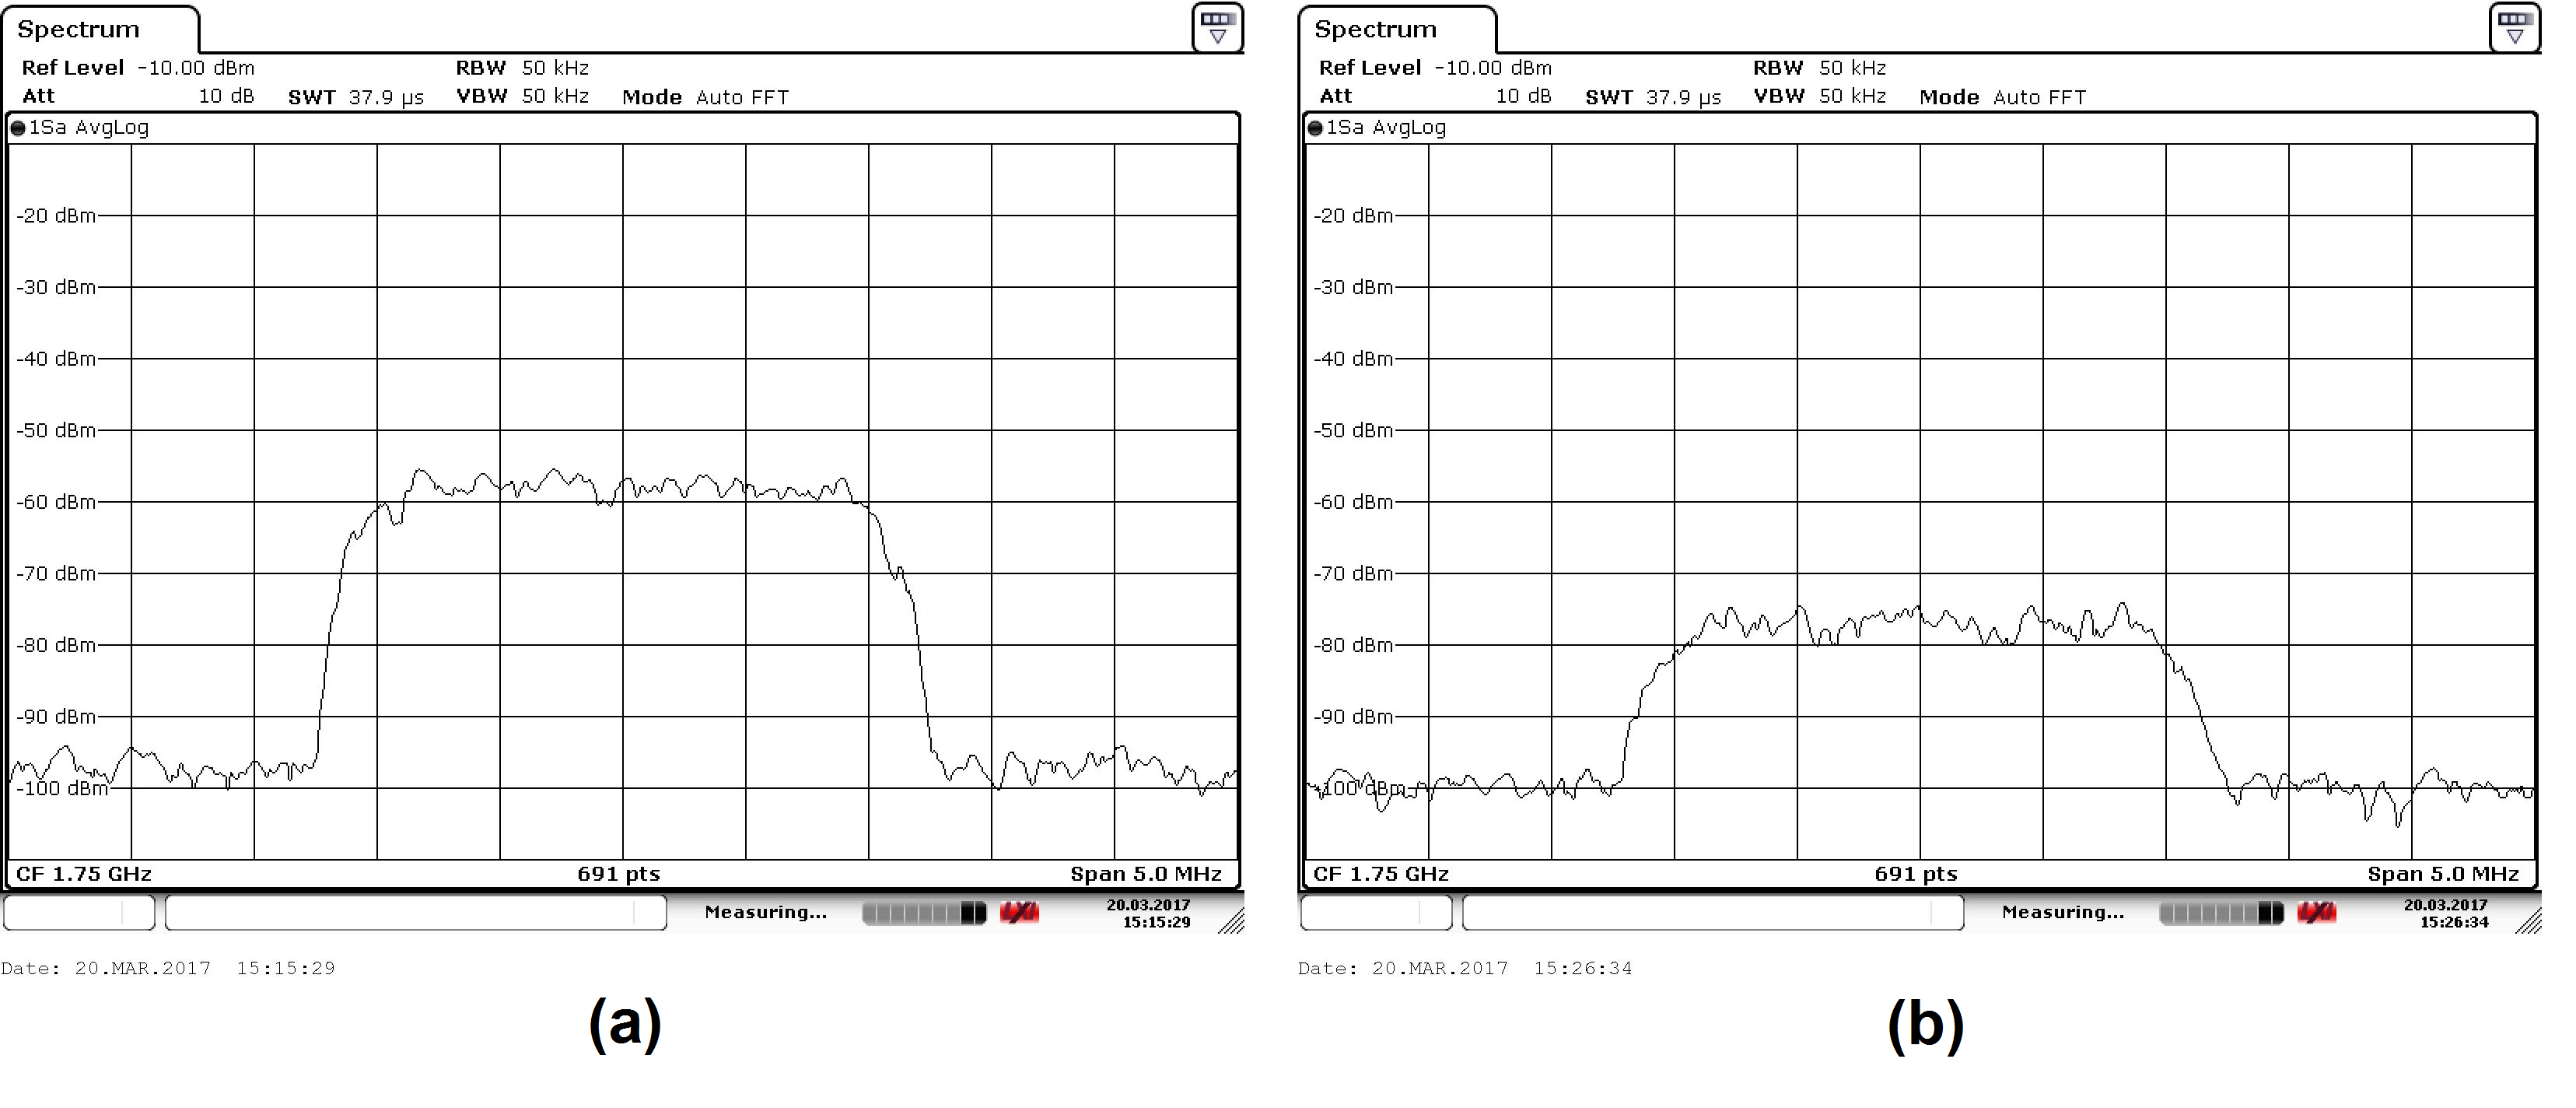
Figure 7. Signal power degradation due to the emulator
Delay measurements
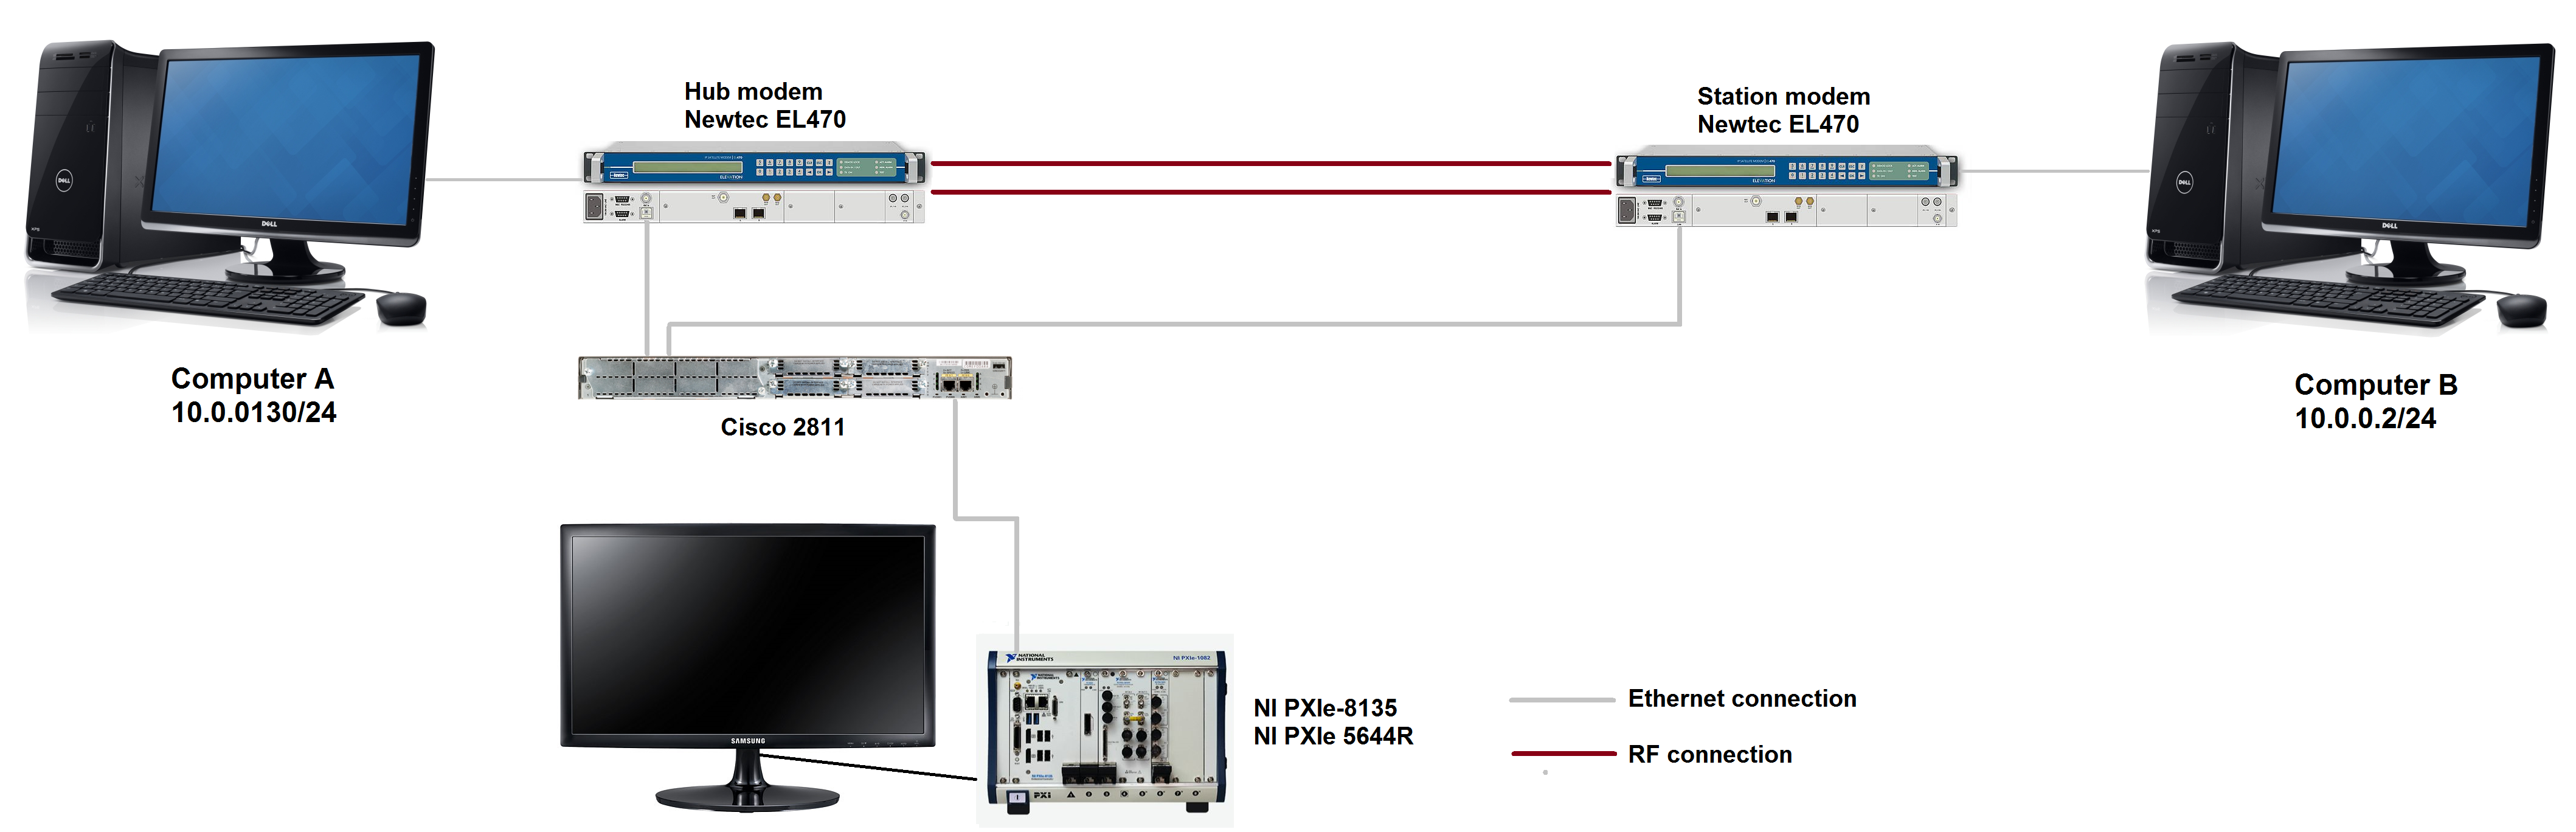
Figure 8. Test bench used to measure a reference round trip time
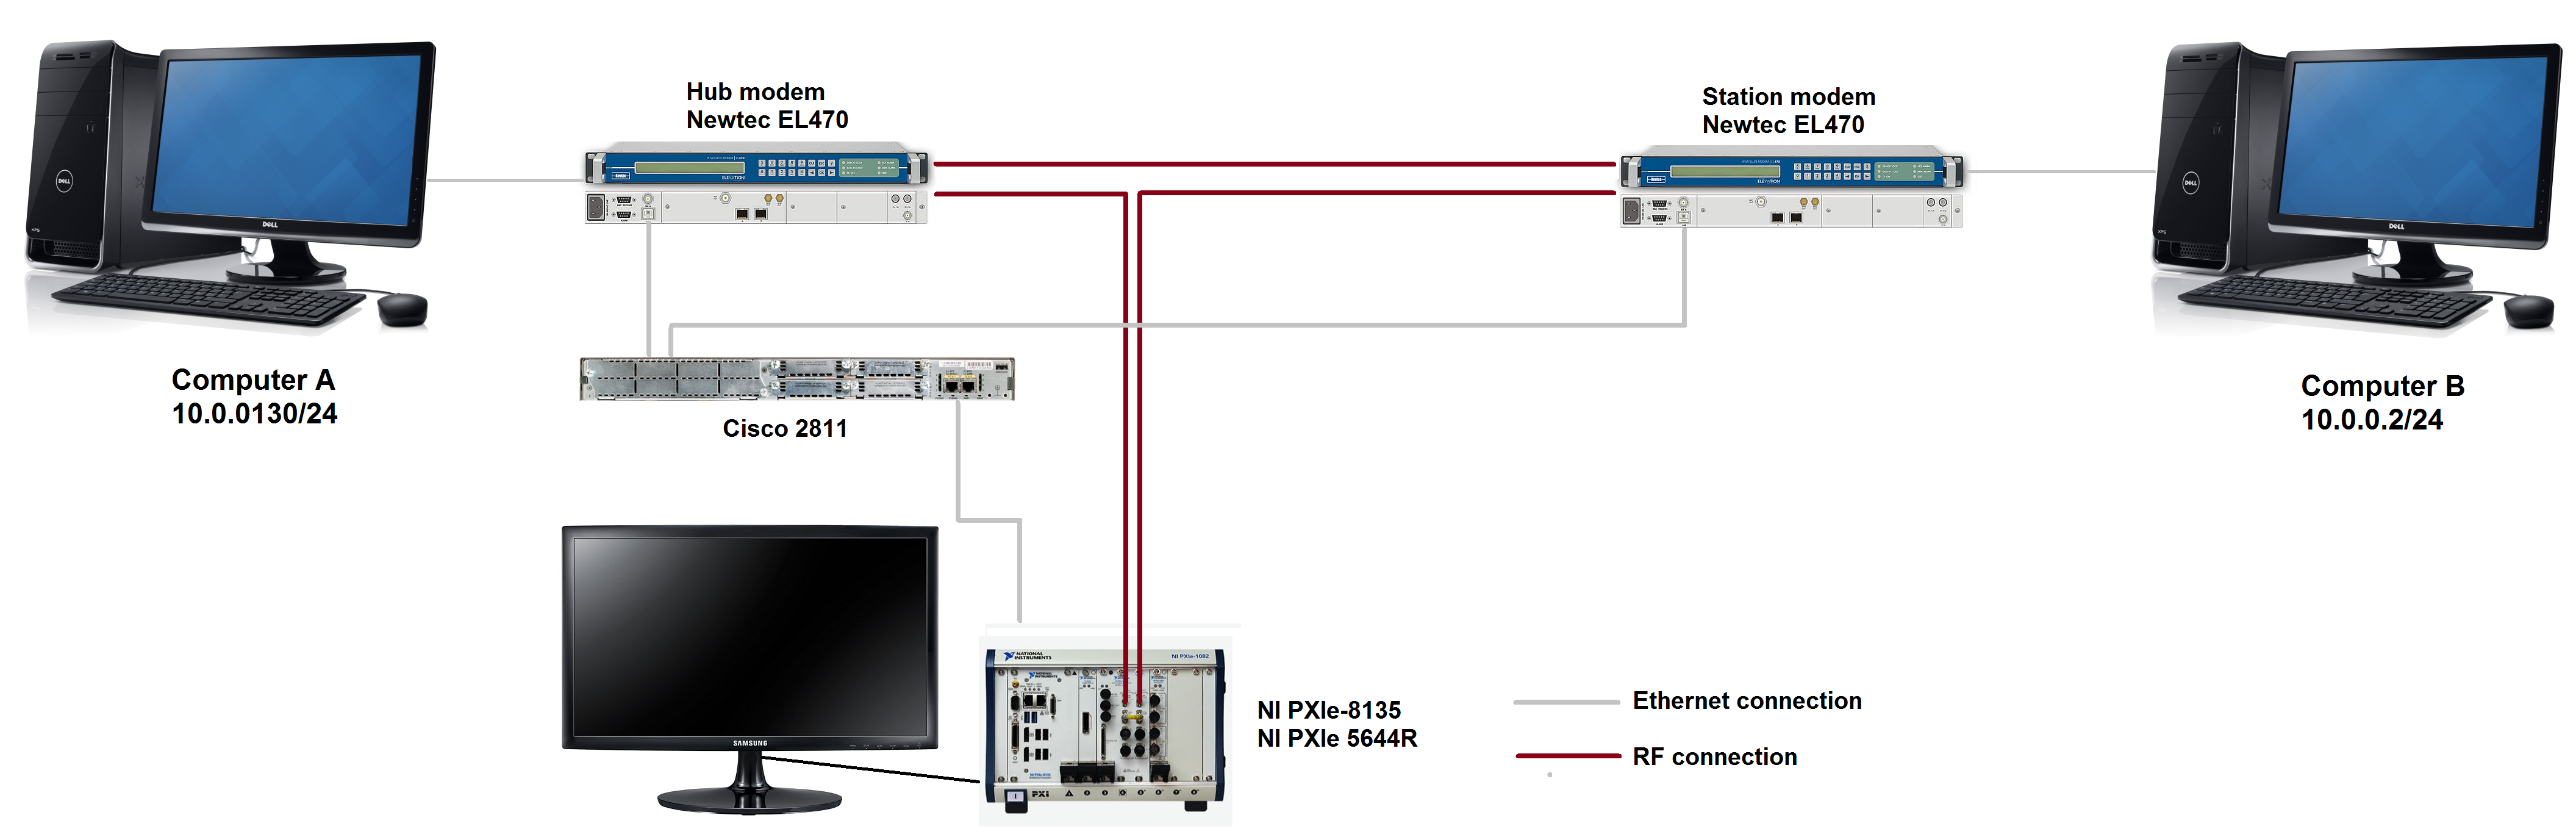
Figure 9. Test bench used to measure the total round trip time
!{width:50%} Total_delay_without_emulator.png!
Figure 10. Round trip time measurements using the ping command (10 packets of 1B and 1500B, respectively) when the emulator is not connected
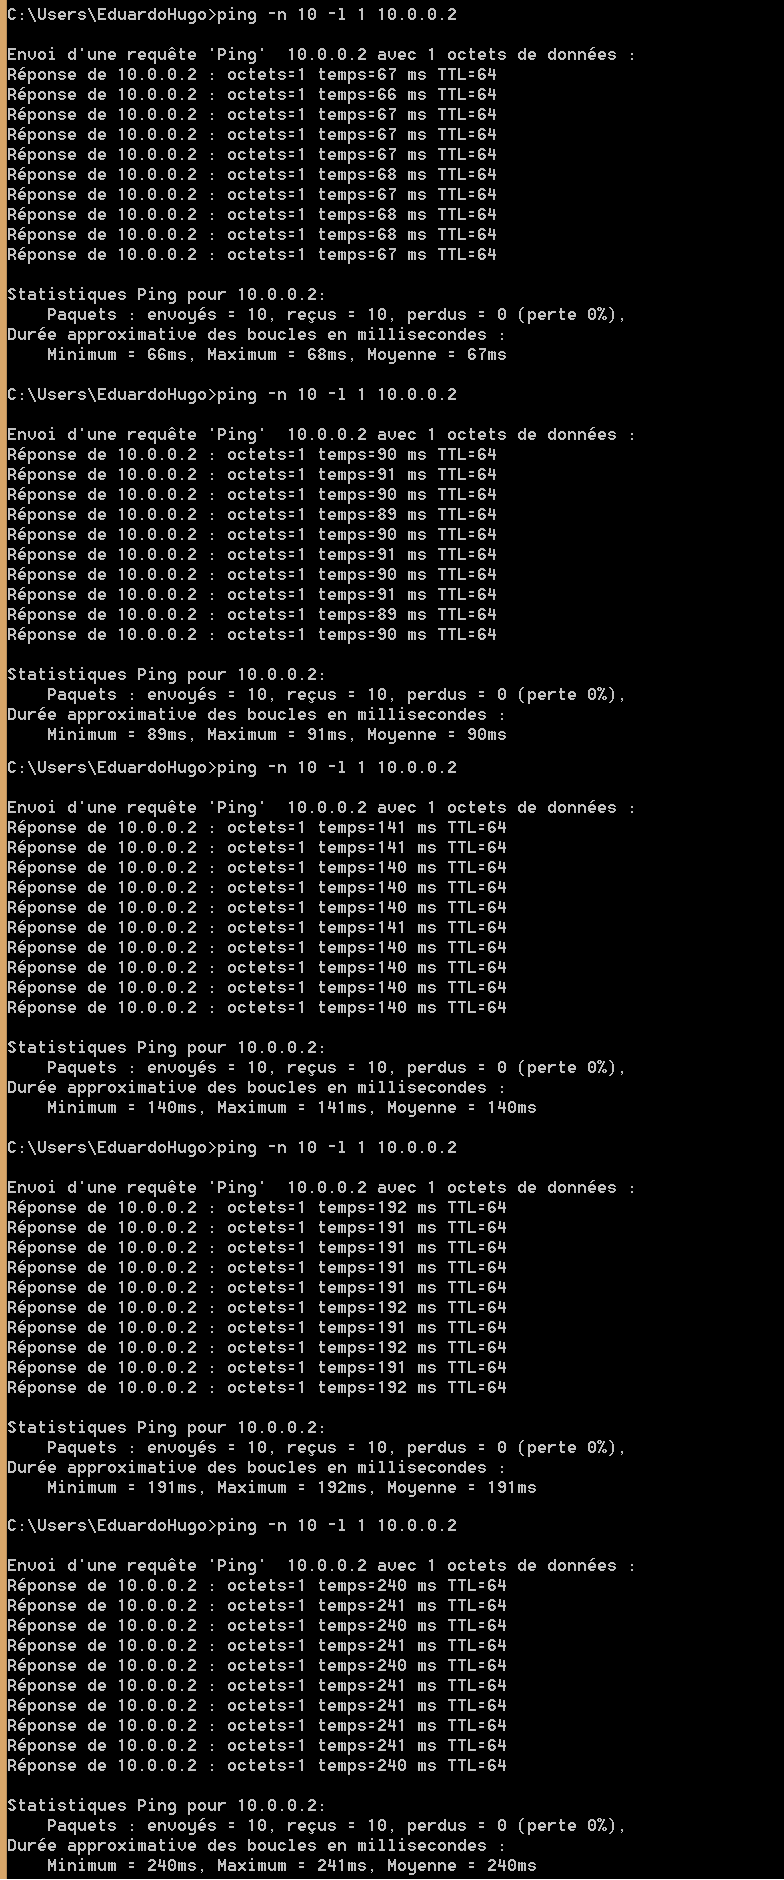
Figure 11. Round trip time measurements using the ping command (10 packets of 1B) when the emulator is connected for different delays values
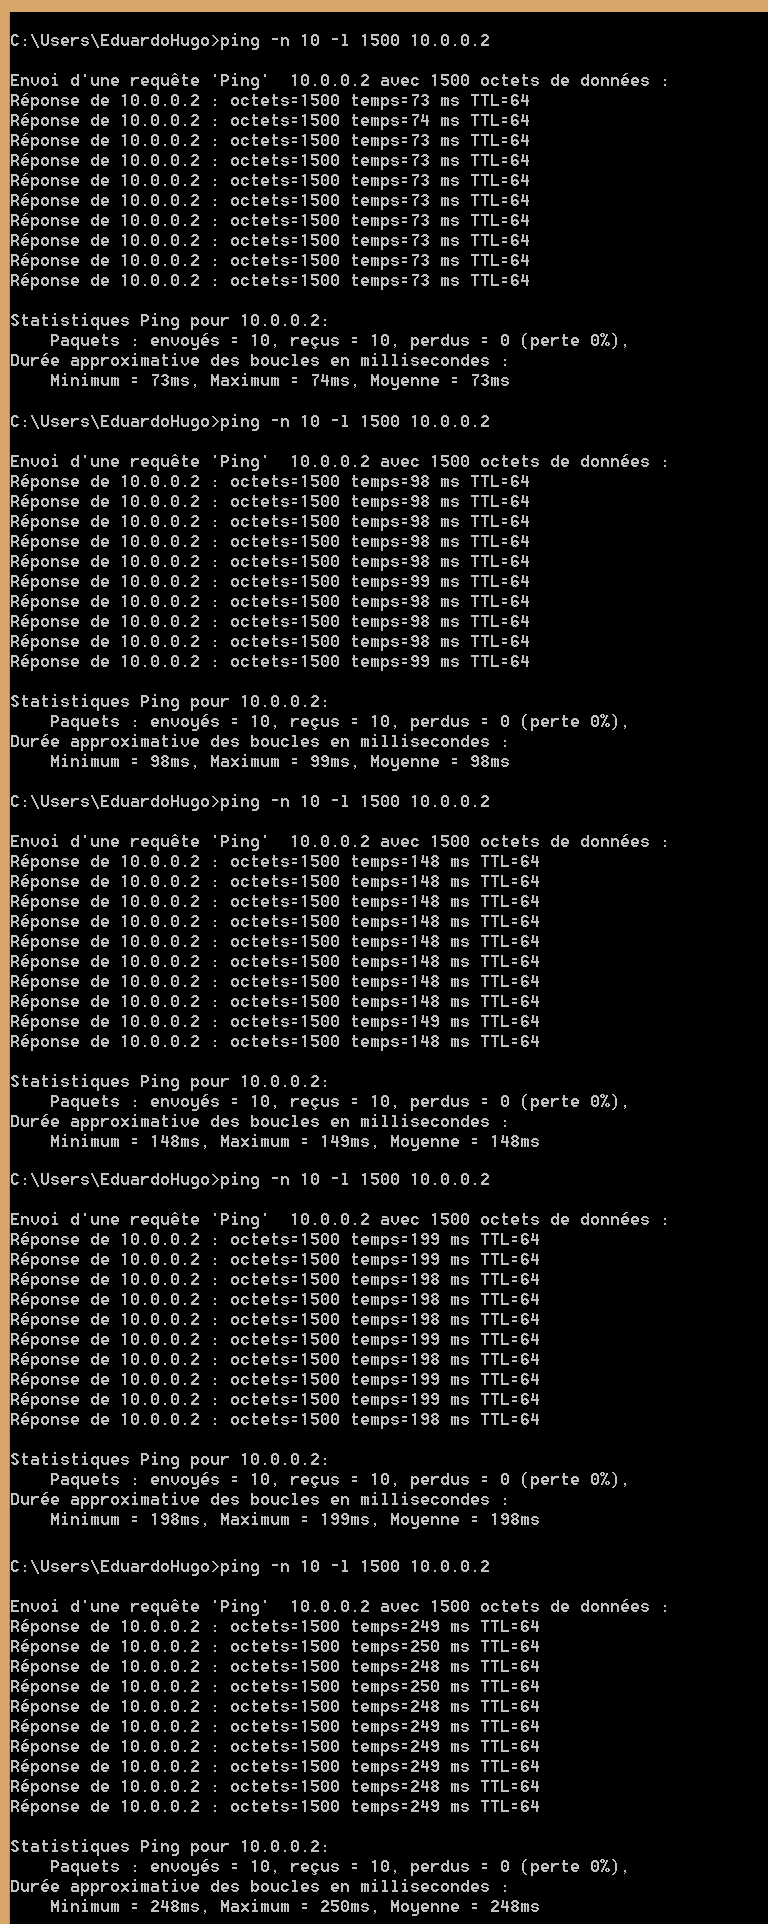
Figure 12. Round trip time measurements using the ping command (10 packets of 1500B) when the emulator is connected for different delays values