System and signal description » History » Version 19
« Previous -
Version 19/20
(diff) -
Next » -
Current version
SCHNEIDER, Joris, 03/27/2017 03:57 PM
Previous : NOAA Agency Next : Receiving antenna choice
System and signal description
Emission system by NOAA satellites
In this part, we will focus on how the useful signal (APT: Automatic Picture Transmission) is emitted by the satellite. It is helpful to understand how the images are created by the satellite and emitted to the ground so that we can appreciate the requirements for the ground station to receive imagery. At first, here is the chain on the satellite for APT signal:
![]()
Satellite Transmission Chain
• AVHRR: Advanced Very High Resolution Radiometer. It is the primary image sensor. Basically, the radiometer is composed of several lenses, a mirror system and other sensors to provide sensitivity to many wavelengths of the electromagnetic spectrum. An Earth image can be received at any moment when the satellite is in the range of the station because it operates continuously. This system provides several types of images in different channels.
• AVHRR Channels: Channel 1 depends on sunlight reflected on Earth because the sensors is sensitive to visible light. To get visible images, the amount of light reflected must be quite high. Channel 2 detects reflected infrared energy and is the usual visible channel for APT. These two channels are the usually used for APT imagery. Other channels are available for specific use (see figure below). Then the analog signal is processed by the MIRP.
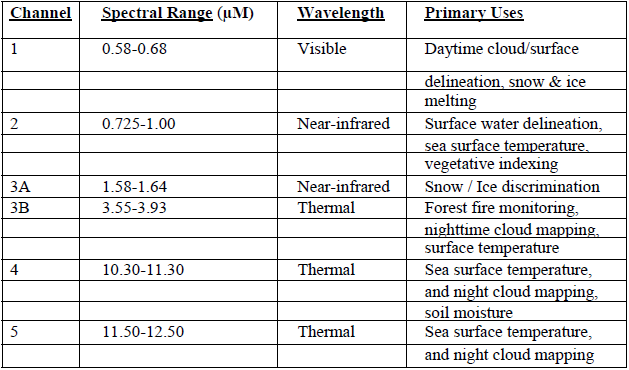
AVHRR Channels
• MIRP: Manipulated Information Rate Processor. At first, the output of AVHRR sensors is amplified and converted to digital information by an analog-to-digital converter (A/D). Then it is processed to create different data streams which match the different signals emitted by the satellite:
-High Resolution Picture Transmission (HRPT): High resolution images with all five channels and telemetry data.
-Global Area Coverage (GAC): Images of all regions of the Earth transmitted to NOAA command and control ground stations on command.
-Local Area Coverage (LAC): HRPT data recorded from selected regions of the Earth transmitted to NOAA command and control ground stations on command.
-Automatic Picture Transmission (APT): Analog transmission of two channels with reduced resolution. In daytime, APT should show visible and IR channels. In night-time, control stations normally set the satellite to replace visible channel by another IR channel with different spectral band as the visible one is no longer useful.
APT signal
APT Format
APT frames are obtained by extracting the 8 most significant bits of the 10 bits of the AVHRR data for each word within the two selected channels which are then multiplexed. AVHRR rate is about 360 lines per minute, so the APT rate is 120 lines per minute of video. During the processing to get APT signal, the system inserts calibration and telemetry information which results in APT format depicted below.
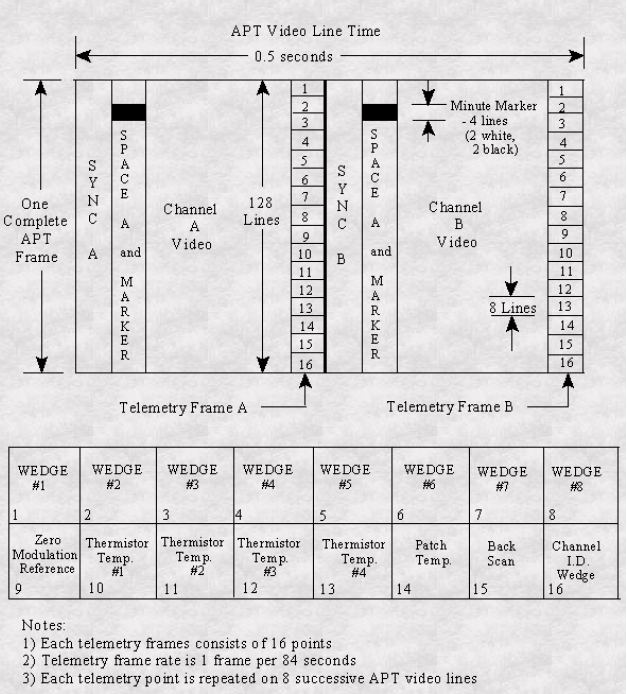
APT Format
On the next figure we can see an example of APT frame image that can be received. Each line is 500ms and contains 250ms of the first channel (visible or IR) and 250ms of a second channel (IR). Each scan line contains image, synchronisation information and telemetry.
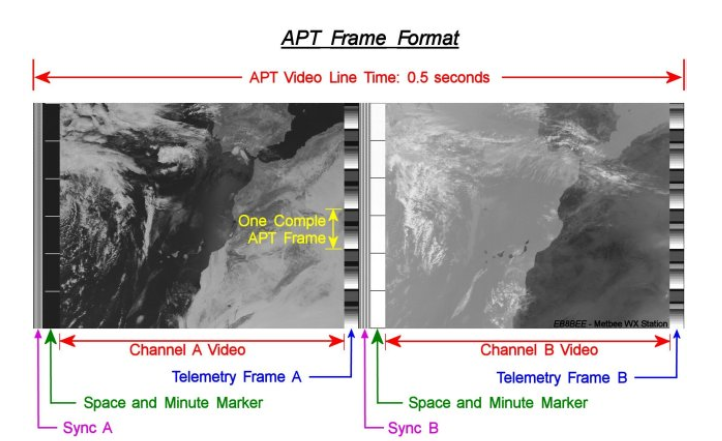
APT Example
APT Modulations
The systems uses Amplitude Modulation and Frequency Modulation. Each 8-bit word of APT data (256 levels) is then amplitude modulated with a 2.4kHz sub-carrier which results in an analog signal with a 34kHz bandwidth. This signal is frequency modulated such that one amplitude corresponds to one frequency on a 137-138Mhz carrier (depending on the satellite). The next scheme summarizes the modulation process.
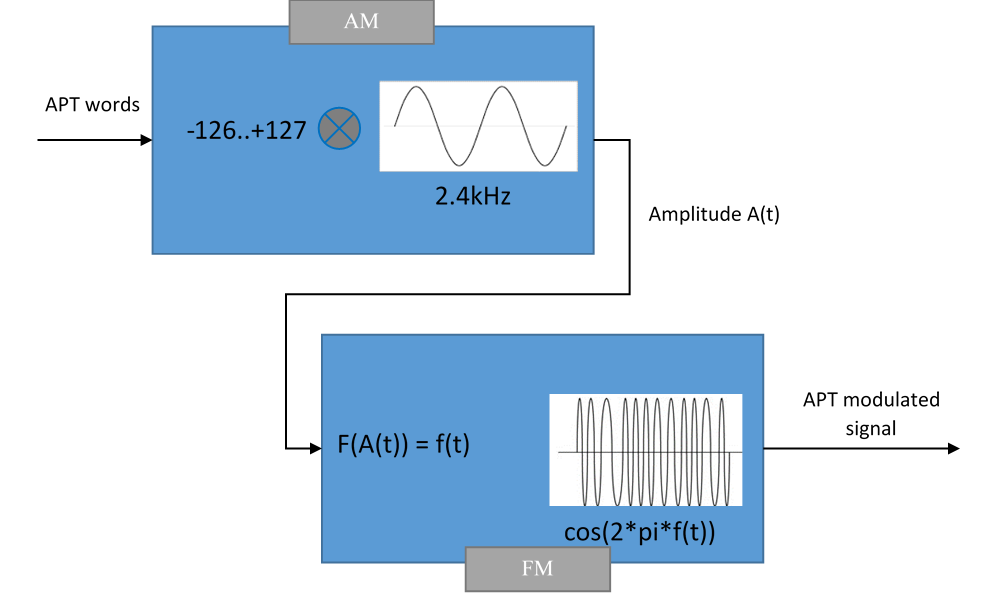
APT Modulation
Signal reception on ground
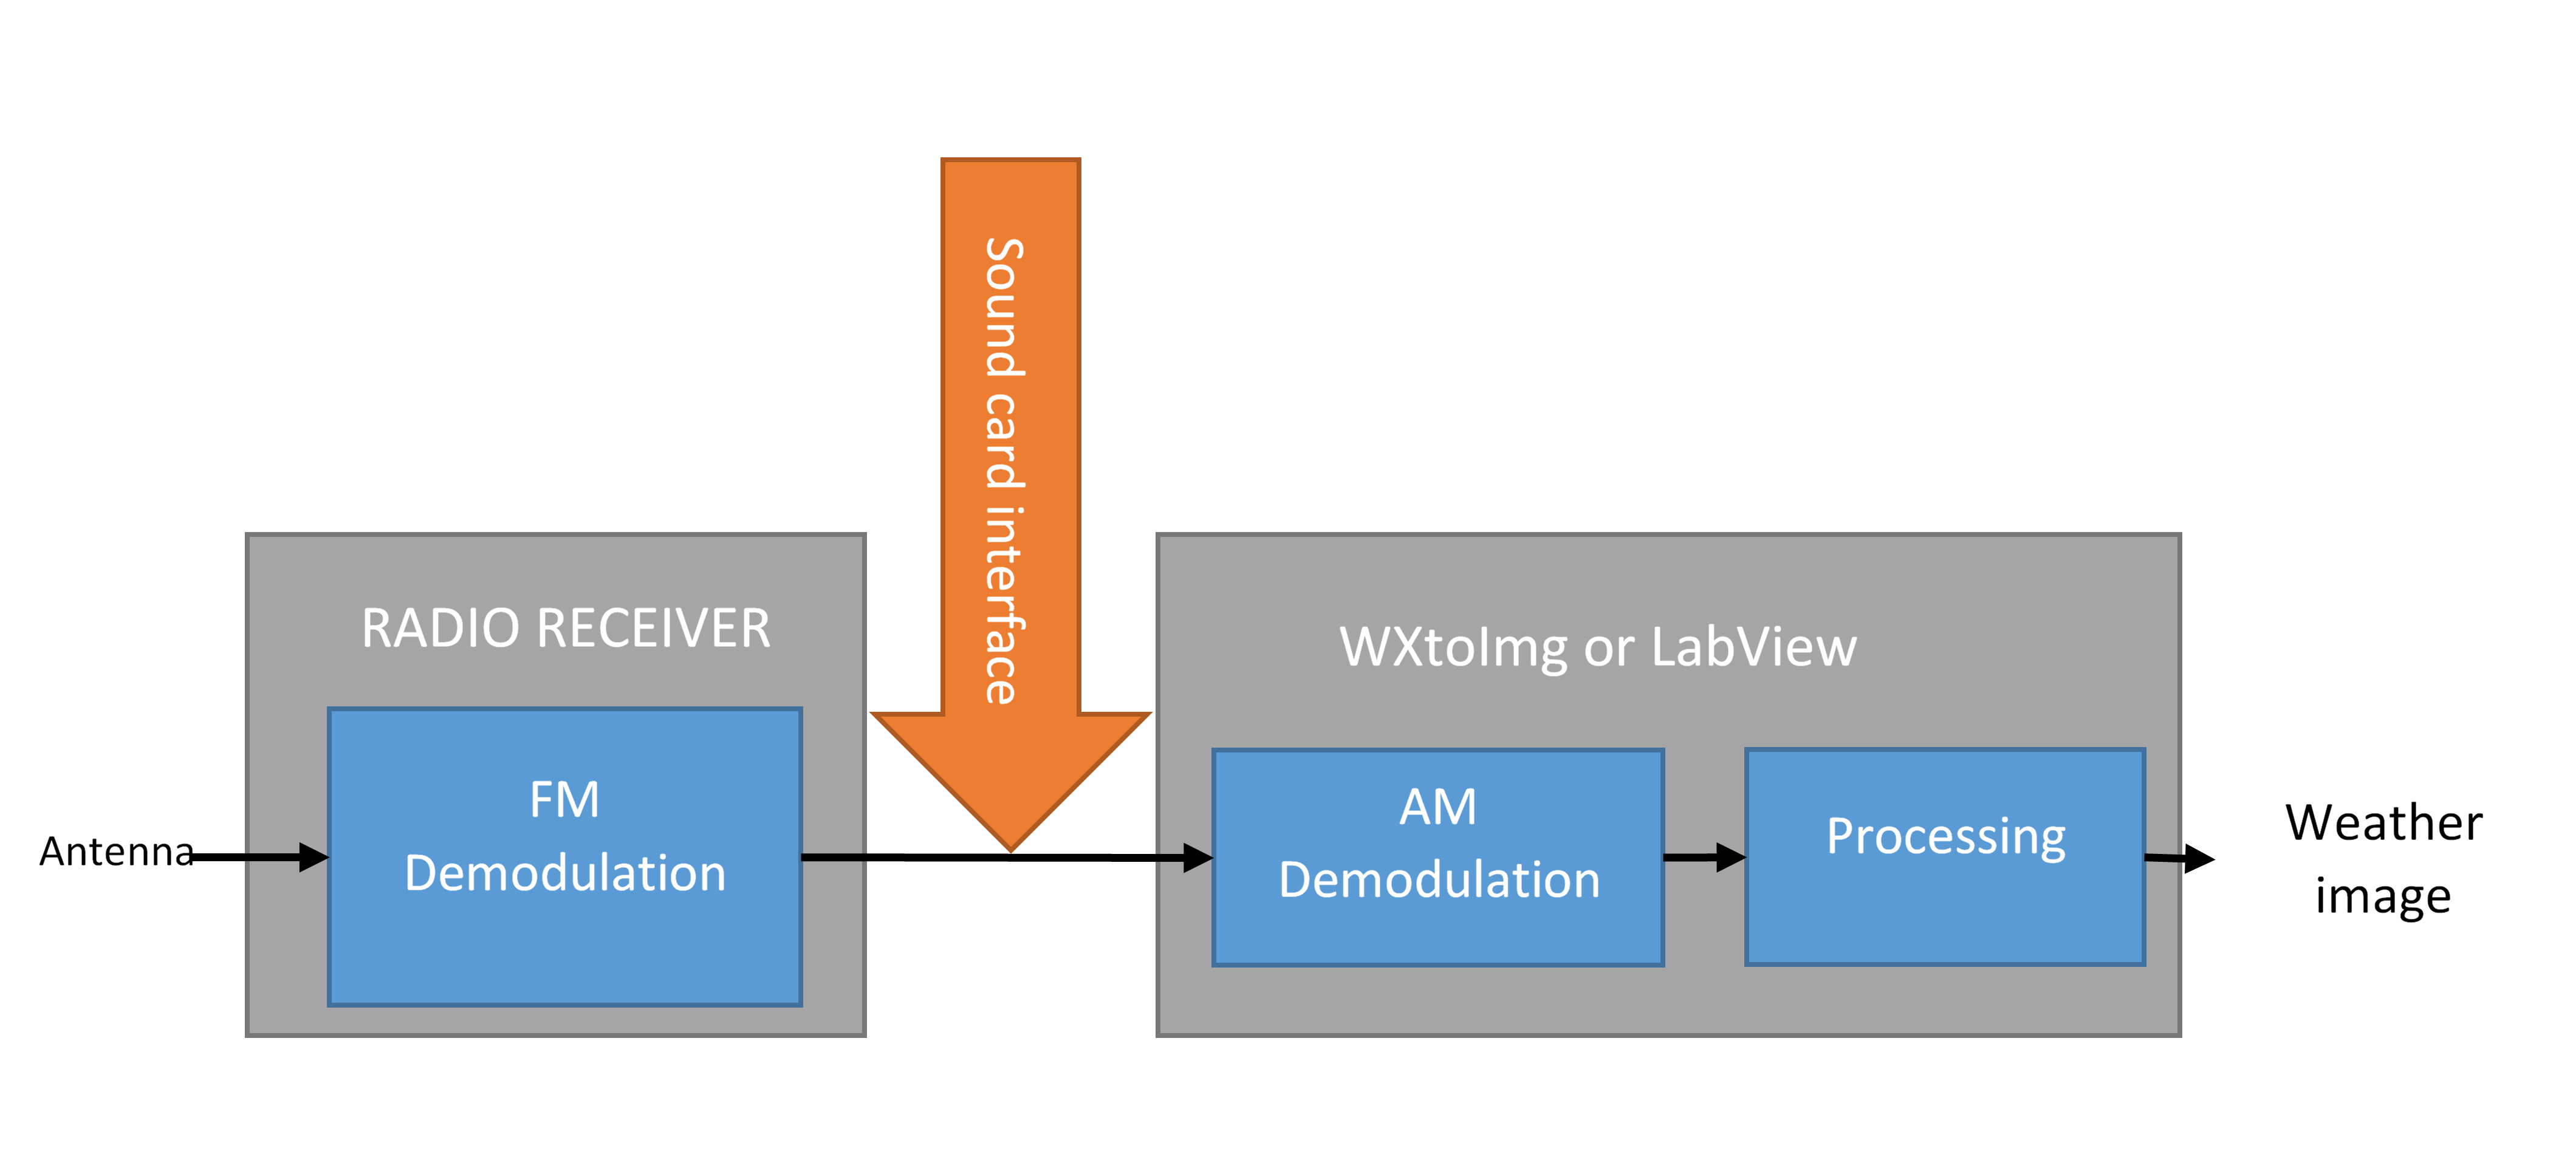
• Antenna: Antenna choice and design is going to be explained in the next section.
• FM demodulation: We will use the available radio receiver in the laboratory which is the Cyber Scan AR5000.
• AM demodulation and processing: We get the frequency modulated signal which is at the output of the radio receiver thanks to an audio cable connected to the sound card of a computer. The amplitude demodulation and the processing is done by using softwares like WXtoImg or Labview to process the signal and extract APT frames in order to see it on the computer.
Once the antenna will be built, to see whether our ground system is well-functioning or not, we will test the antenna by first listening to the output of the radio receiver. If we can hear a special structure within the audible signal, it means that it is well-demodulated in frequency. Then, thanks to the open-source software WXtolmg, we can see the images as the software performs directly the remaining processing. After these steps, we will replace this software by a Labview program to see the APT images.
Previous : NOAA Agency Next : Receiving antenna choice
