Results » History » Version 15
« Previous -
Version 15/20
(diff) -
Next » -
Current version
BLANCO GUTIERREZ, Andrea, 03/23/2015 10:35 PM
9. Results
Finally, several receiving pictures can be seen below. The first imagen of all sequences is the original received image from the satellite; thereafter, all the others are modify after being customized by some filters of the WXtoimg software in order to emphasize some parameters such as the colour or the thermal effect.
Keep in mind when evaluating the following images presented that on March 19, 20, and 21 measurements were taken from different locations on the ground to ensure that the antenna worked fine before fixing it on the roof. After verifying that, on March 23 was established the antenna on the roof and once again the images were received from the satellite.
The time when the satellites pass by a fixed point on Earth varies slightly every day then is important to be taken into account the elevation angle and position of the satellite. From Toulouse we can see that the satellites pass according to the sequence: Satellite 19, 18 and 15. In order to probe the antenna, the first day was taking into account the satellite 15 due to the satellite 19 and 18 had already passed at that moment.
March 19, 2015 | 16:12 UTC
From NOAA 15:
The operating frequency of this satellite is 137. XX MHz. So for being close to the operating frequency of the designed antenna, as it can be seen in the images below, a good reception of the image is achieved although this has an inferior quality compared to what will be shown later.
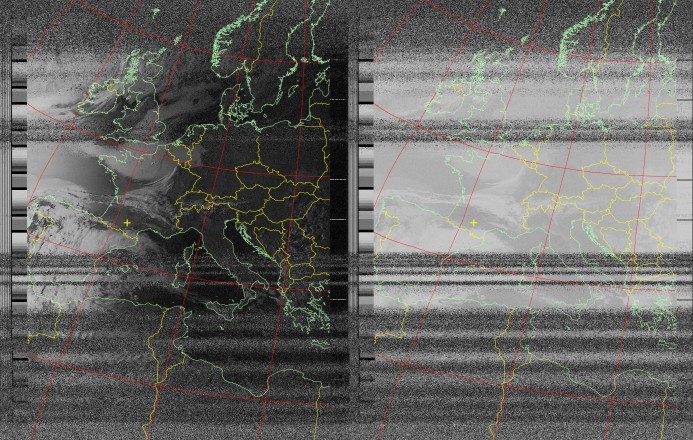
Figure 1:
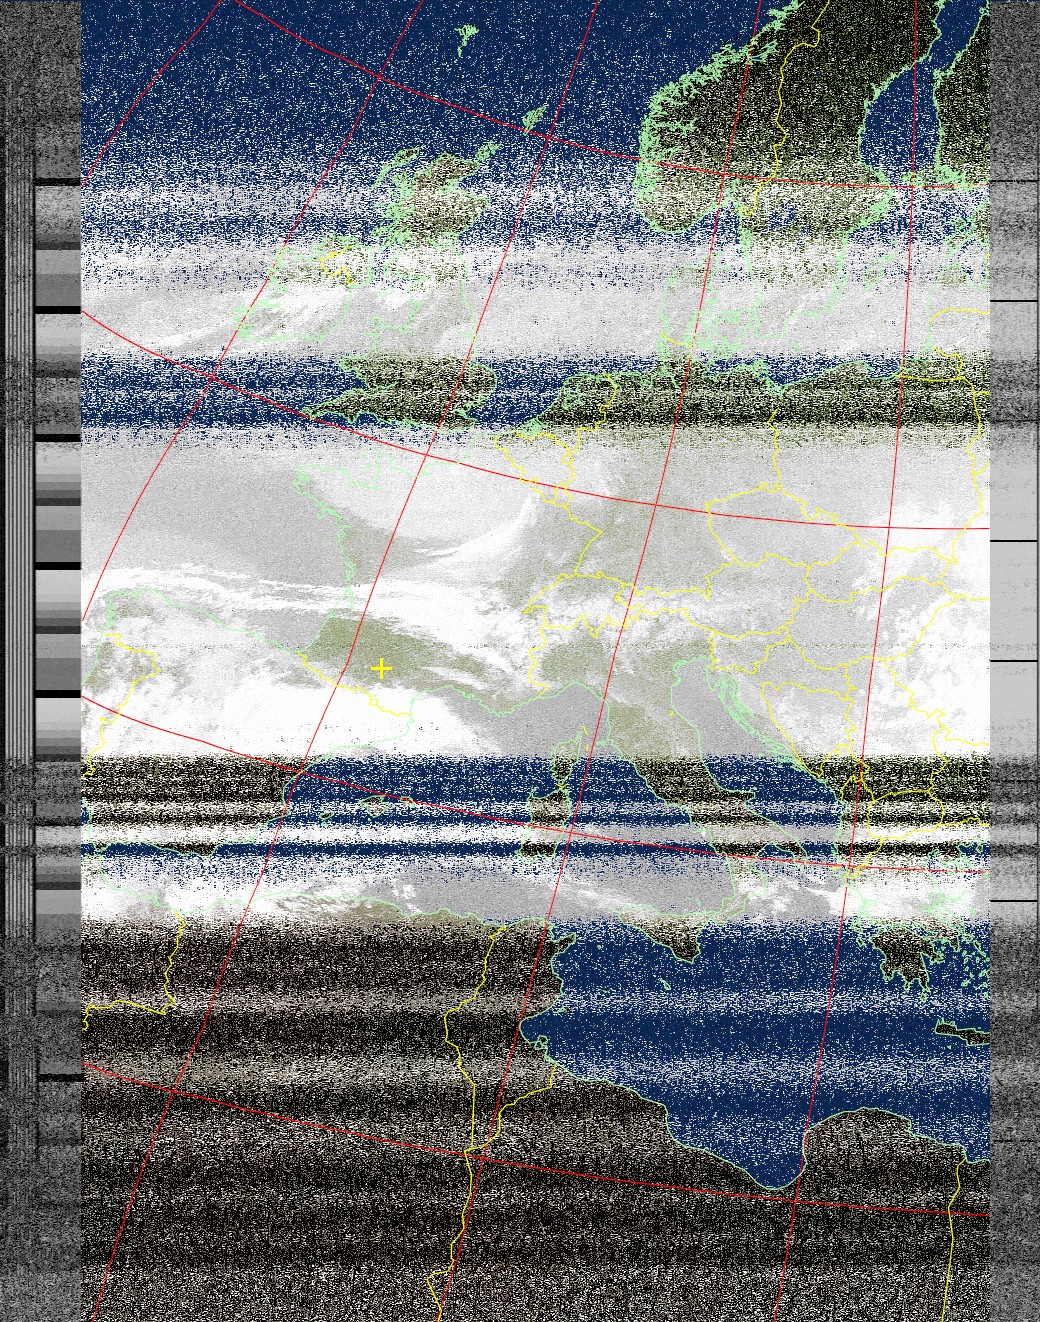
Figure 2:
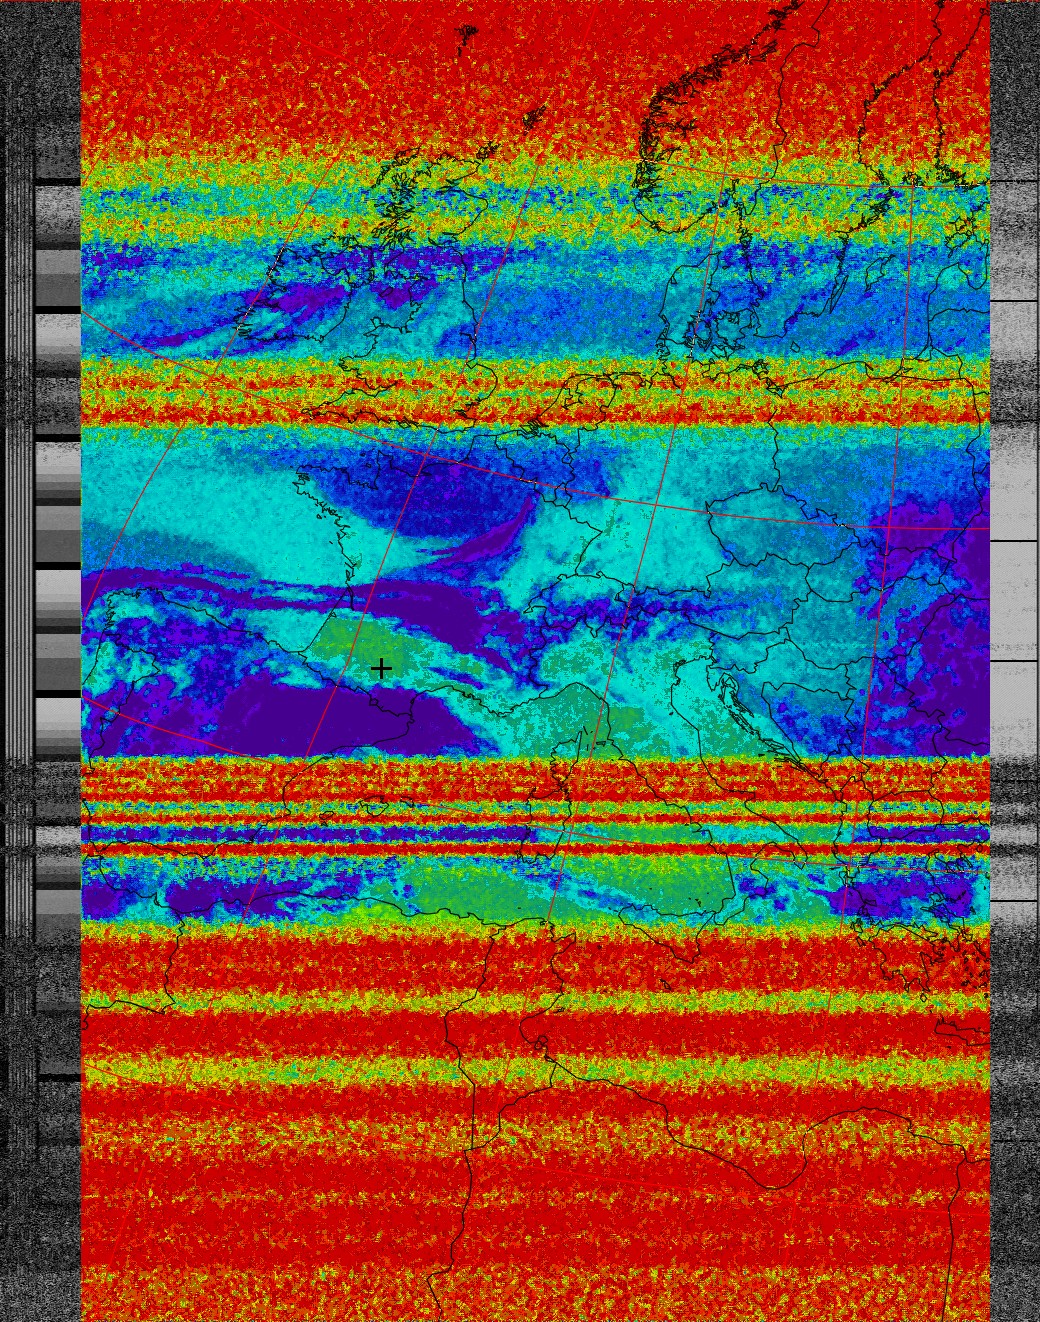
Figure 3:
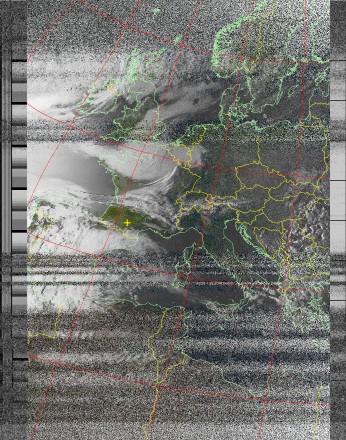
Figure 4:
March 20, 2015 | 12:29 UTC
From NOAA 19
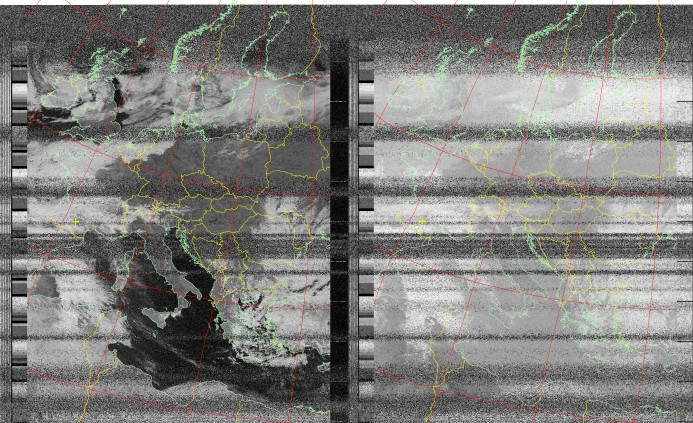
Figure 5:
March 21, 2015 | 12:18 UTC
From NOAA 19: First pass
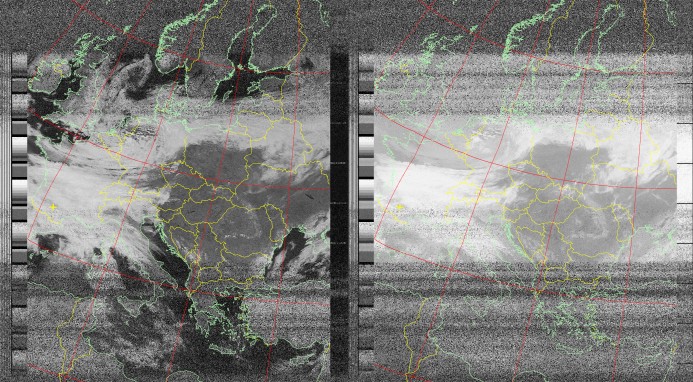
Figure 6:
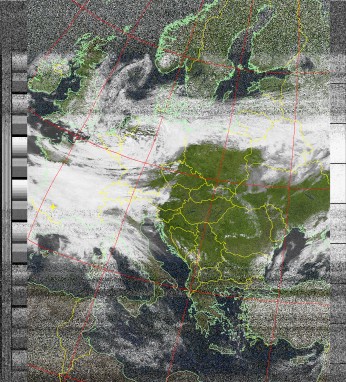
Figure 7:
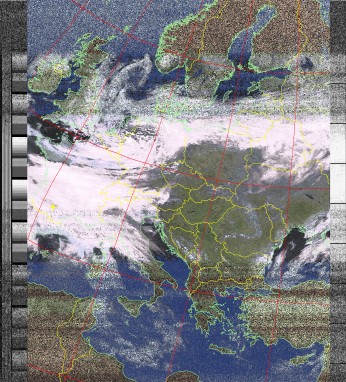
Figure 8:
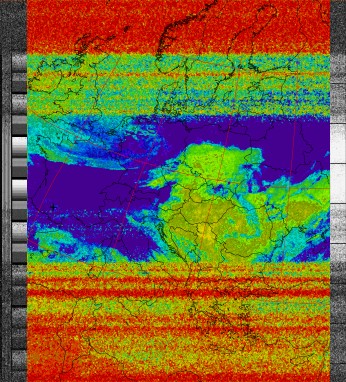
Figure 9:
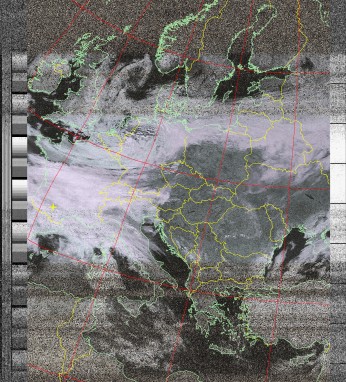
Figure 10:
From NOAA 19: Second pass
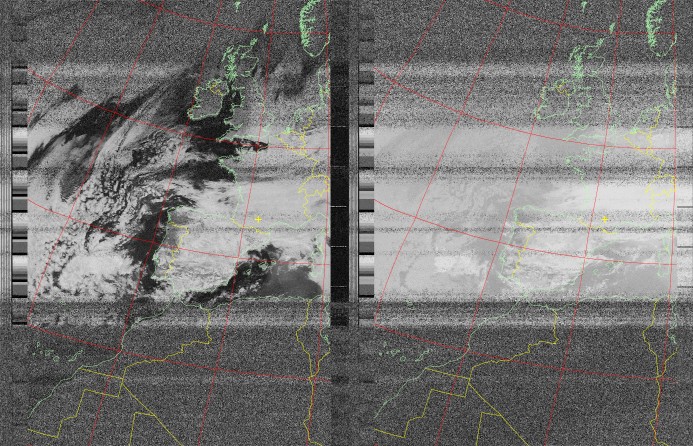
Figure 11:
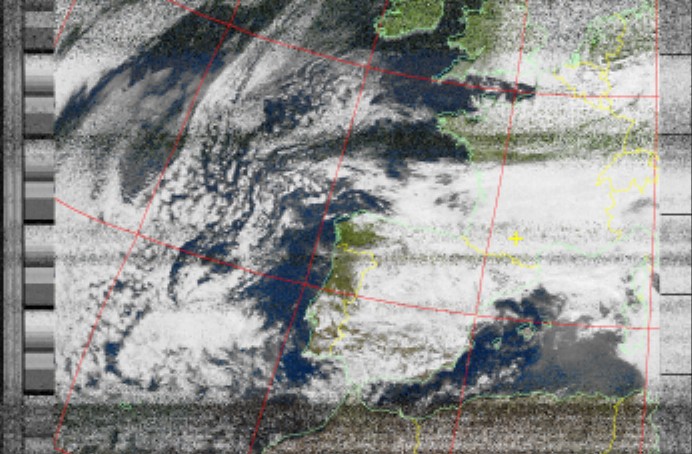
Figure 12:
